

Message
Message
|
doi: 10.1007/s10439-015-1385-5 Fluid-Structure Interaction Analysis of Papillary Muscle Forces Using a Comprehensive Mitral Valve Model with 3D Chordal StructureAbstractNumerical models of native heart valves are being used to study valve biomechanics to aid design and development of repair procedures and replacement devices. These models have evolved from simple two-dimensional approximations to complex three-dimensional, fully coupled fluid-structure interaction (FSI) systems. Such simulations are useful for predicting the mechanical and hemodynamic loading on implanted valve devices. A current challenge for improving the accuracy of these predictions is choosing and implementing modeling boundary conditions. In order to address this challenge, we are utilizing an advanced in vitro system to validate FSI conditions for the mitral valve system. Explanted ovine mitral valves were mounted in an in vitro setup, and structural data for the mitral valve was acquired with μCT. Experimental data from the in vitro ovine mitral valve system were used to validate the computational model. As the valve closes, the hemodynamic data, high speed leaflet dynamics, and force vectors from the in vitro system were compared to the results of the FSI simulation computational model. The total force of 2.6 N per papillary muscle is matched by the computational model. In vitro and in vivo force measurements enable validating and adjusting material parameters to improve the accuracy of computational models. The simulations can then be used to answer questions that are otherwise not possible to investigate experimentally. This work is important to maximize the validity of computational models of not just the mitral valve, but any biomechanical aspect using computational simulation in designing medical devices.1. IntroductionBeginning with Da Vinci, the structure and function of the mitral valve have been of great interest to anatomists, physicians, surgeons, scientists, and engineers. Yet, a complete understanding of the complex mechanical function of the normal mitral valve remains elusive. The anatomy of the mitral valve (MV) includes two asymmetric leaflets attached to the left ventricle at the annulus, and numerous chordae tendineae that serve to attach the leaflets to the left ventricle via the papillary muscles. The chordae connect to both the free edge of the leaflet (primary chords) but also to the ventricular surface (secondary chords) (Fig. 1). Some smaller chords (tertiary) do not connect to the leaflet at all but rather provide connections between adjacent chords. The function of the valve throughout the cardiac cycle is complex, and involves interaction between all of the aforementioned structures. Common diseases of the MV are related to dysfunction the valvular apparatus as a whole, or due to alteration or disruption of particular parts of the valve. Stenosis (resistance to forward blood flow), regurgitation (reversal of flow), and prolapse (displacement of leaflets towards the atrium) are pathologic conditions that can result from valvular tissue abnormalities and disruption. To treat such pathology, MV repair is the most popular and most reliable surgical treatment. However, one of the unsolved problems in MV repair is the ability to predict the optimal repair strategy for each patient. Experimental studies have helped to improve repair techniques, and now, computational simulations are becoming increasingly utilized in an attempt to understand the complex MV dynamics.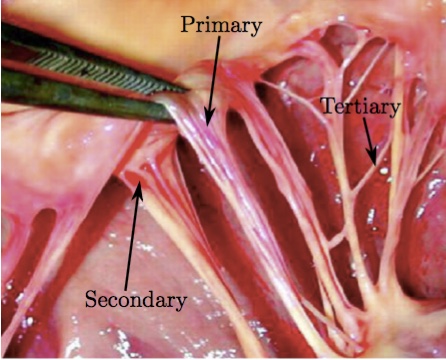 Figure 1: Primary chord attached to the edge of the mitral valve leaflet and secondary chord attached to the belly of the mitral valve leaflet. Tertiary chords connect adjacent chords, and do not connect to the leaflet.
In the case of our group's ongoing analyses of the mitral valve, finite element analysis was introduced three decades ago to begin to understand the mechanical stresses in the valve in normal [16] diseased [17,19,20] and surgically repaired states [3,21,34,35]. More recently, we have utilized fluid-structure interaction (FSI) analysis to understand the complex dynamics mitral valvular function [6,8,9,18]. Of course, many other research groups have since also utilized finite element analysis, computational fluid dynamics, and fluid-structure interaction model in order to understand various aspects of mitral valve function (see [2] for a comprehensive review).
Most of these models utilized MV geometries obtained either by parametric modeling, by image reconstruction of markers placed on the valvular apparatus, or from excised valve specimens. More recently, MV modeling strategies have been transitioning to morphologically realistic patient-specific MV modeling utilizing real-time 3D imaging data [30,41,42]. However, one of the obstacles preventing accurate patient specific modeling, has been the inability to accurately represent the complex chordal structure of the native valve.
For the sake of efficiency, current computational models of the MV often use simplified geometry. As current imaging modalities cannot provide a complete description of structure and distribution of the chordae in vivo, general anatomic information from clinical studies is commonly implemented into computational MV modeling for the chordae. The models commonly take advantage of the chordal beam-type structure to justify the use of beam elements (i.e., have no bending degrees of freedom) and the thinness of the leaflets to justify the use of shell elements [6,24,27-29,31,36,38,39,43].
Some models do represent the leaflets with 3D elements (e.g., tetrahedral) but often only utilizing a single layer in order to reduce computational time. Further, the detailed 3-D branching nature of the chords has not been well-represented. All such assumptions sacrifice the accuracy of the computational results. The chordal structure is an important functional part of the mitral valve and should not be omitted or simplified, especially when investigation of the pathologies related to chordae tendineae is of interest. Improvement in computer technology has been exponential in recent decades, and now allows the use of more detailed models, without unnecessary limitations in regard to chordal geometry and its complexity.
The purpose of this investigation was to develop an anatomically realistic FSI model of the mitral valve that includes leaflet and chordal elements that accurately recreate the natural anatomy of the mitral valve, based on CT images of a normal valve. In addition, we set out to include the annular and papillary muscle components in order to accurately simulate physiologic conditions. We examined the results with a particular focus on determining the resulting forces on the chordae tendineae throughout the cardiac cycle. Lastly, the computational studies were compared with experimental in vitro measurements, to validate our FSI model results. In order to fully validate a computational model, as the valve closes, the hemodynamic data, leaflet dynamics and force vectors can be compared between the in vitro experiments and the FSI model. This paper focuses on the papillary muscle forces comparing their magnitude and direction.
It is anticipated that further advancements of clinical imaging modalities, coupled with the next generation of computational techniques will enable physiologically more realistic simulations.
2. MethodsTo develop the 'valve-specific' geometry for the FSI simulation of the mitral valve with preserved chordal structure, we utilized an ovine mitral valve that was obtained from Superior Farms California. The process of model development included (1) CT scanning, (2) image processing to develop 3D model, and (3) high quality, robust mesh generation (Fig. 2). We then utilized an FSI approach to evaluate opening and closing of the valve, and to determine the time dependent chordal forces. To validate the results, explanted ovine mitral valves were mounted in an in vitro setup and subjected to normal cardiac cycle pressures.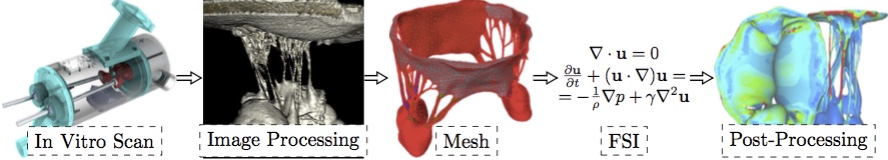 Figure 2: Sequential experimental techniques to develop valve-specific geometry with preserved chordal geometry.
Image AcquisitionThe geometric data for the MV model was acquired with micro-computed tomography (lCT). The atrial chamber and aortic section were removed from the left heart simulator [32], and the left ventricle was fixtured to the lCT gantry using a custom adaptor plate. The mitral valve geometry was retained from the earlier hemodynamic characterization. The mitral valve was scanned in air under ambient pressure (~1 atm, mitral leaflets were open) using a vivaCT 40 system (Scanco Medical AG; Bruttisellen, Switzerland). The geometry was acquired at 39 lm voxel size (~600 image slices) using scanning parameters optimized for low density soft tissues (55 keV energy, 109 lA intensity, and 300 ms integration time).Image ProcessingA simple threshold was applied to acquired lCT images to segment the image into inside, outside and disputed regions. Given those region assignments, a PowerWatershed algorithm [4,5] was applied to perform the final segmentation. Subsequently, Marching Cubes was applied to the binary image to extract a triangulated surface. All image processing and surface reconstruction was performed in the MATLAB/ Octave-based interoperative toolkit Biogezom [7].Mesh Generation and SegmentationFollowing surface extraction, ten iterations of volume-conserving smoothing [23] was applied to the surface to remove staircasing while conserving geometry and volume. Subsequently, the surface was remeshed such that surface triangles were proportional to the gradient-limited feature size (GLFS) [1,6,22]. The resulting geometry was segmented into anterior and poster leaflet section, anterolateral and posteromedial papillary muscles, and individual branched chordae tendineae (Fig. 3). Segmentation of the surface mesh allows for the prescription of anatomically specific material parameters. Finally, a layered, scale-invariant tetrahedral grid was generated such that there were three layers of tetrahedra through the thickness of the anterior and posterior leaflets [1,6,22]. The final mesh consisted of 217,462 tetrahedra. At run time, the the leaflet tetrahedra were converted to quadratic elements by the IMPETUS solver.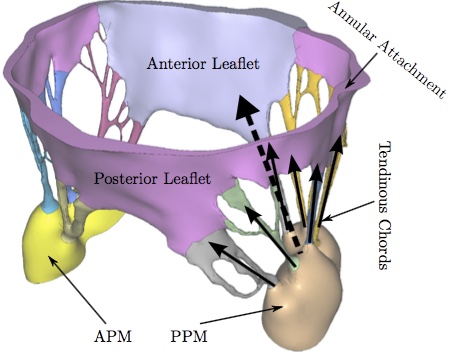 Figure 3: The mitral valve system is comprised of the annular attachment at the atrioventricular junction, two leaflets, tendinous chords and the anterior-lateral/posterior-medial papillary muscles (APM/PPM). Color coding identifies leaflets, PMs and individual chordal branches. The valve is shown in the open configuration with the closed configuration valvular-ventricular interaction forces illustrated at individual chordal branches (solid arrows) and the resulting full PM force vector (dashed arrow).
Fiber DirectionsThe mitral leaflet tissue material behavior (Eq. 2) is characterized as an oriented entangled population of crimped collagen fibers embedded in an isotropic phase of gel-like glycoproteins and a network of isotropic elastin (Fig. 4)[8,18].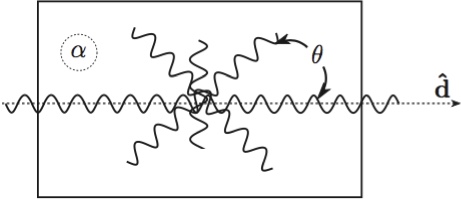 Figure 4: Structural paradigm for mitral leaflet tissue. Collagen fibers (wavy lines) are embedded in an isotropic matrix (α). Locally, the fibers have a mean preferred direction (d^). The standard deviation (σ) determines the Gaussian distribution of collagen fibers about that mean as a function of the splay angle (θ).
Determination of collagen fiber orientation in the mitral valve is both critical and challenging. Currently, no perfect method exists for the comprehensive experimental measurement of the three dimensional collagen architecture that includes all of the substructures of the mitral valve. Two dimensional characterization that focuses on the leaflets unfolded into a plane has been carried out with small angle light scattering (SALS).15,37 Recent efforts have been made to map 2D SALS data to 3D image-derived models,25 using control points and interpolation. However, these mappings exclude the mitral valve chordae and artefacts from excision such as the relaxation of collagen fibers and subsequent re-orientation remain. An added challenge is how to determine fiber orientations noninvasively.
The approach we have adopted is best described as a geometric technique that is subject to experimentally determined boundary conditions. It too is not perfect but it does have some advantages: it is fast, it is fundamentally three dimensional, it requires no invasive experimental techniques and it accommodates a realistic transition between chordae and leaflets.
The gist of the method is that we have some certainty with respect to some areas of alignment. These are our boundary conditions. For example, we know that the fiber orientation is mostly aligned with the axis of the chordae, and the free edges of the leaflets. We also know that fiber directions will be approximately in the plane of the leaflets. From our previous SALS studies of fiber orientation [15], we know that fibers will be oriented approximately vertically at the fibrous trigones, and approximately circumferentially along the annulus at the midpoints of the anterior and posterior leaflets. Lastly, we assume that to be mechanically optimal the fiber field must be slowly varying between these fixed directions. Thus, we solve a modified Laplace problem to determine the unspecified fiber directions in between.
More specifically, let Ω be the volume over which fiber orientations need be determined, and S be the set of seed points where the fiber directions d^ are known. We solve Laplace's equation for the 3x3 matrix M over Ω with Dirichlet boundary data constructed from d^:
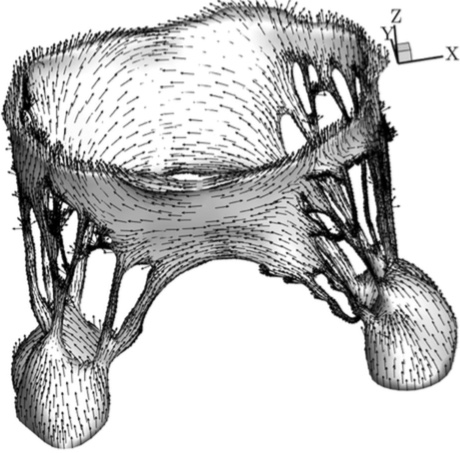 Figure 5: The fiber direction at each point of the mitral valve mesh.
Constitutive ModelThe constitutive model for the material properties utilized a three-dimensional splay invariant, based on an approximation of a three-dimensional Gaussian distribution of fibers [10]. The model is defined in terms of the 2nd Piola-Kirchhoff stress, S, as follows
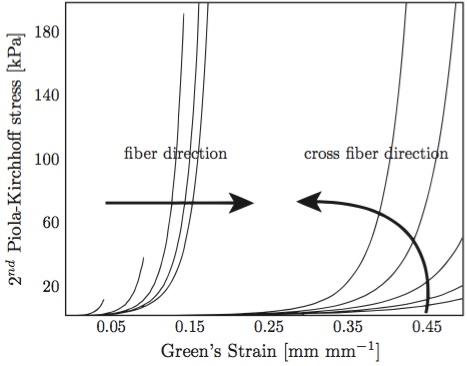 Figure 6: Anterior mitral valve stress-strain behavior, fiber and cross-fiber directions. Arrows indicate the effect of increasing strain levels in the orthogonal direction [8,18].
The passive fiber model is defined in the fiber coordinate system, and is given by a micro-structural model [10] based on the physiology of crimped collagen fibers (see Alg. 1); specifically, given a fiber stretch λ, this model returns the true stress σ/λ and tangent modulus dσ/dλ of the fiber. There are three physiologic parameters (material constants defined at the top of the algorithm) that the user must supply. The discontinuity in the dσ/dλ curve indicates that the model presented in Alg. 1 predicts a stress σ response that is continuous and once-differentiable in stretch λ up to fiber failure. Specific parameter values used in this model are given below. For all structures, the bulk modulus, κ, was 2.80x10⁴ kPa; the isotropic parameter μ was 10.0 kPa and the fiber stiffness, Ef was 4.8x10⁴ kPa. Dimensionless parameters H0/r0 and R0/r0 were 14.5 and 1.75 for the anterior leaflet, 7.0 and 1.0 for the posterior leaflet, and 8900.0 and 25.0 for the papillary muscles. For all chordae, R0/r0 was 5.0. H0/r0 varied for most chordae, ranging from 1.35 for the strut chordae to 90 for the marginal chords. FSI Model SolutionA major challenge in modeling the fluid-structure interaction of cardiac valves is the dealing with the contact between the leaflets at coaptation. Various approaches have been adopted to address this challenge, including interface capturing approaches and boundary tracking approaches. In this study, we adopted an approach based on smooth particle hydrodynamics, wherein the fluid is modeled as a collection of discrete particles.Specifically, at run time 346,676 discrete particles were created in the fluid domain. Fluid motion and boundary interaction was solved with the the IMPETUS Afea SPH Solver, while large deformation in the solid mitral valve was simultaneously solved with the IMPETUS Afea Solver. All solid elements were fully integrated removing the possibility of hourglass modes and element inversion that plagues the classic under-integrated elements. Both fluid and solid domains and their interaction were solved with an explicit integration scheme. All simulations were solved on a standard workstation. Parallel acceleration was achieved with a Tesla K40 GPU with 12 GB of Graphic DDR memory and 2880 CUDA Cores. Both FE and SPH solvers use the GPU for parallel processing thus avoiding the need for a large compute cluster. To confirm that convergence was reached, h-refinement of the finite element mesh was performed and the solution was found to yield same results. Boundary ConditionsThe fluid particles were confined in a pipe-like rigid structure surrounding the MV model and prescribed velocity boundary conditions were applied to the open ends to develop clinically relevant pressures, see Fig. 8. The prescribed velocity profiles used in the simulations are based on the data used in the in vitro measurements [13] and shown in Fig. 11.The points at the bottom of the papillary muscles were fixed in all three directions, as well as the points on the annular attachment. 3. ResultsThe leaflet and chordal stress computed by the FSI simulations showed a distinct increase in stress magnitude at full closure (Fig. 7b), as compared to the open state (Fig. 7a). The stress was not symmetrically distributed, a result of the valve specific geometry, which is itself not symmetric. The local maxima of the principal stress values (1 MPa) were found primarily on the chordae tendineae and their connections to the leaflets.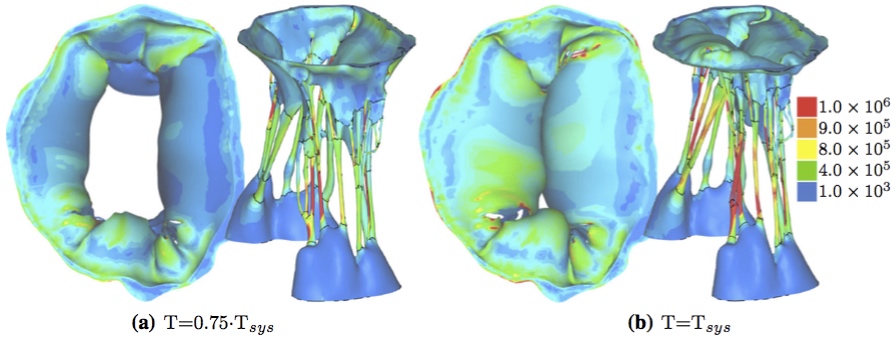 Figure 7: First deviatoric principal stress [Pa], FSI simulation results at two different time points.
Figure 8 shows the displacement of the fluid particles in z direction at the peak systole where the closure of the MV is reached, T = Tsys. It can be seen that, at this time point, the pistons driving the flow of the particles have moved only by 6 mm for the MV to reach the closure. Thus, not many particles flowed backward to the left atrium before the MV closed. Also, the least moving particles can be found on the outside of the valve leaflets and chordae, where the pressure develops and causes the valve to close. 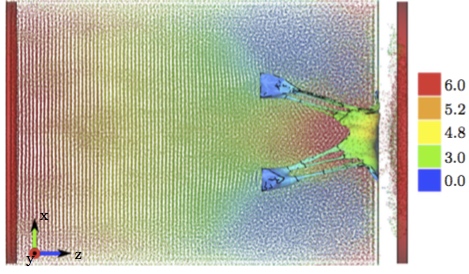 Figure 8: Displacements in z direction [mm] of both the fluid particles and the solid structures (pistons to prescribe velocity boundary conditions and MV model), at T = Tsys.
To evaluate the chordal force results, we examined the forces at the individual attachment points of the chords to each papillary muscle. The maximum force was found to be 0.80 N at the attachment of a strut chord attached to the anterior papillary muscle (Fig. 9). 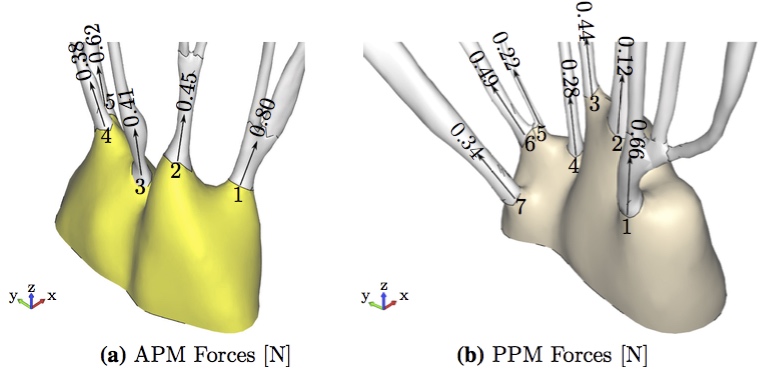 Figure 9: Maximum forces in individual chordal attachment points (a) APM Forces [N] (b) PPM Forces [N].
Further, we examined the forces at each chordal attachment point at the beginning and end of systole for both the APM and PPM (Fig. 10). It can be observed that despite significant changes in the directions of the individual vectors (red arrows), the overall averaged directions (blue arrows), did not vary significantly. 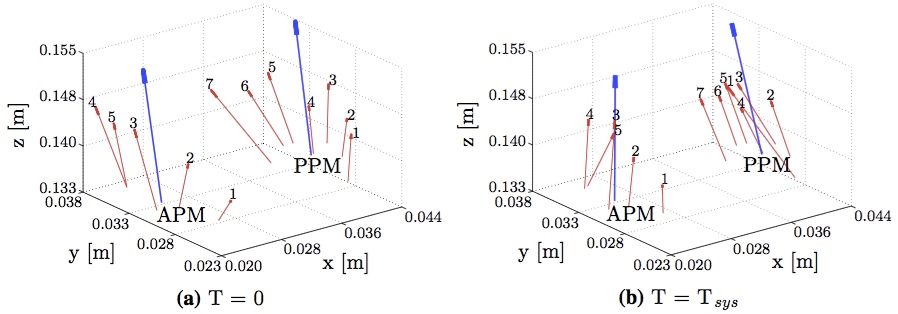 Figure 10: The individual force vectors of the APM and PPM chordal attachment points at the beginning (a) and end (b) of systole are shown in red. The average force vector is shown in blue.
To validate our results, we compared the computational FSI results to the experimental results [13] from the in vitro system (Fig. 11) at a transvalvular pressure of 100 mmHg. 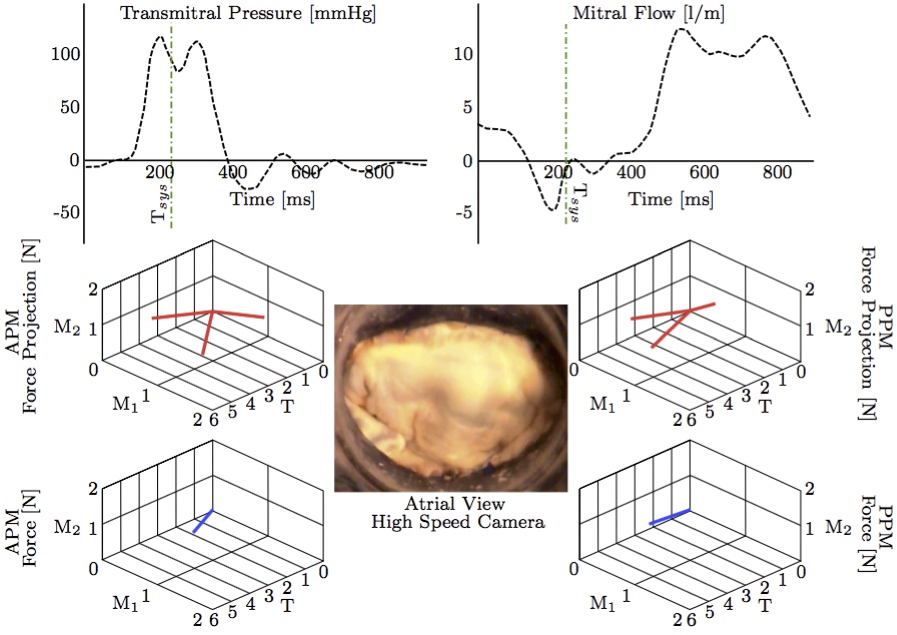 Figure 11: Three-dimensional PM force vectors of the anterolateral and posteromedial PM forces (APM and PPM) and their projections (bottom) correlated with synchronized transmitral pressure and flow curves (top) and high-speed imaging (middle) [13]. The valve is here shown in a fully closed systolic configuration (green dot-dashed line) with normal PM position.
There was excellent agreement both in terms of direction and magnitude of the overall force vectors for the anterior and posterior papillary muscle attachments (Fig. 12). The total size scaled force magnitude was 2.6 N per papillary muscle for both the FSI and in vitro results, as previously also found in other studies [18,31]. 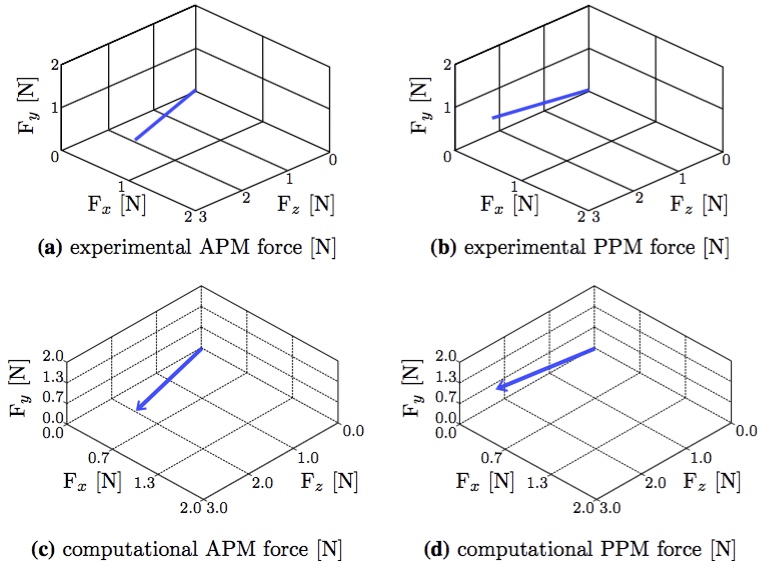 Figure 12: The experimental results (from Fig. 11) compared with the computational FSI results (from Fig. 10b). The coordinate systems were rotated and centered in order to compare equivalent directions (a) experimental APM force [N] (b) experimental PPM force [N] (c) computational APM force [N] (d) computational PPM force [N].
Further, the time course chordal attachment forces along all three axes were in very good agreement between computational FSI and experimental result (Fig. 13). The total force closely follows the left ventricular pressure curve (Fig. 14) with a maximum of 2.6 N at a transvalvular pressure of 100 mmHg, as noted previously. It is also worth noticing the the pressure values start rising before the force values, which is physiologically correct. 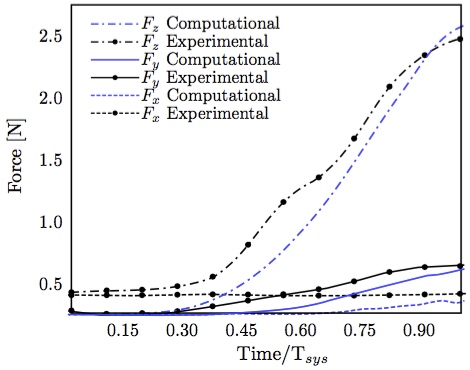 Figure 13: Individual components of posterior-medial papillary muscle force compared with experimental measurements [13].
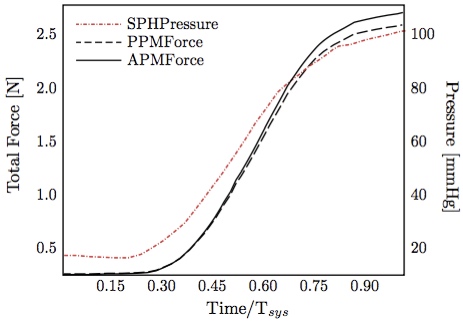 Figure 14: Anterior-lateral / posterior-medial papillary muscle forces obtained computationally and SPH pressure (equivalent to left ventricular pressure) curve.
4. DiscussionVentricular dilatation causes a displacement of the PM tips away from the annulus in the apical, lateral, and posterior directions, thereby inflicting an increased tethering force on the chordae tendineae [11,14,26,33].In this paper, we compared two different valves from two different species to validate the computational results. We used an ovine mitral valve to acquire the structural data for the model and compared it with PM force measurements performed in vitro on a porcine mitral valve. The gross structures of mitral valves across species, especially human, porcine, ovine, are similar, which is why the porcine and ovine hearts are excellent models for human cardiac anatomy [40]. Independent of species, the mitral valves have two main leaflets, commissures, and a network of primary, secondary and tertiary chordae tendineae anchoring to the papillary muscles which are positioned at about the same species-independent location. We have shown that when the valve closes, the resulting (averaged) forces point in the same direction and, scaled to size, are about the same magnitude. Therefore, we may conclude that although the porcine, ovine and human valves are different in various subtle ways, in the large scale comparison between the biomechanics of porcine and ovine valve (and hence human), it does not have significant impact on the averaged PM force directions and magnitudes. This approach of analyzing papillary muscle mechanics for a 'PORVINE' heart, i.e., analysis created by superimposing PORcine and oVINE data, has been previously suggested by Ingels and Karlsson [12]. In vitro and in vivo force measurements are important in validating and adjusting material parameters in computational models. The models will answer questions that are otherwise not possible to investigate experimentally, for example, when the force is measured to decrease in one part of the valve, it must be increased in another part to meet static equilibrium [33]. This work is important to maximize the validity of computational models of the mitral valve. Extracting patient specific geometries of MV while preserving its chordal structure is challenging and recent computational models therefore simplify the models used. Some experimental research work, such as by Jensen et al. [13], can only be used for validation of computational models and algorithms if a subject-specific comprehensive MV model with 3D chordal structure is utilized. Computational models with simplified chordal structures would not provide the information necessary for comparison with the experimental data. To mention the limitations of this methods paper, the method presented is used with and results are shown based on single simulation/experiment, i.e., this is a case study. Thus, although accurate outcome is shown, for statistically meaningful results more simulations are necessary. Moreover, even though the model used is very detailed as is, higher level of detail could still be reached. However, for this purpose, where the forces are measured at the papillary muscle tips, it is not expected to have significant impact. If some detail is lost in the image processing phase, it is largely limited to the area of individual attachment points of the chords to leaflets, not papillary muscles. Furthermore, even though the parameters for the material model are provided above, considering the applied pressure on the leaflets and the forces in chordae counteracting this to have equilibrium, this balance can be achieved for a large range of material parameters employed for the leaflets and chordae. Measuring force and displacement on separate tissue parts such as individual chordae and leaflets, however, enables improved material parameters and modeling. Appendix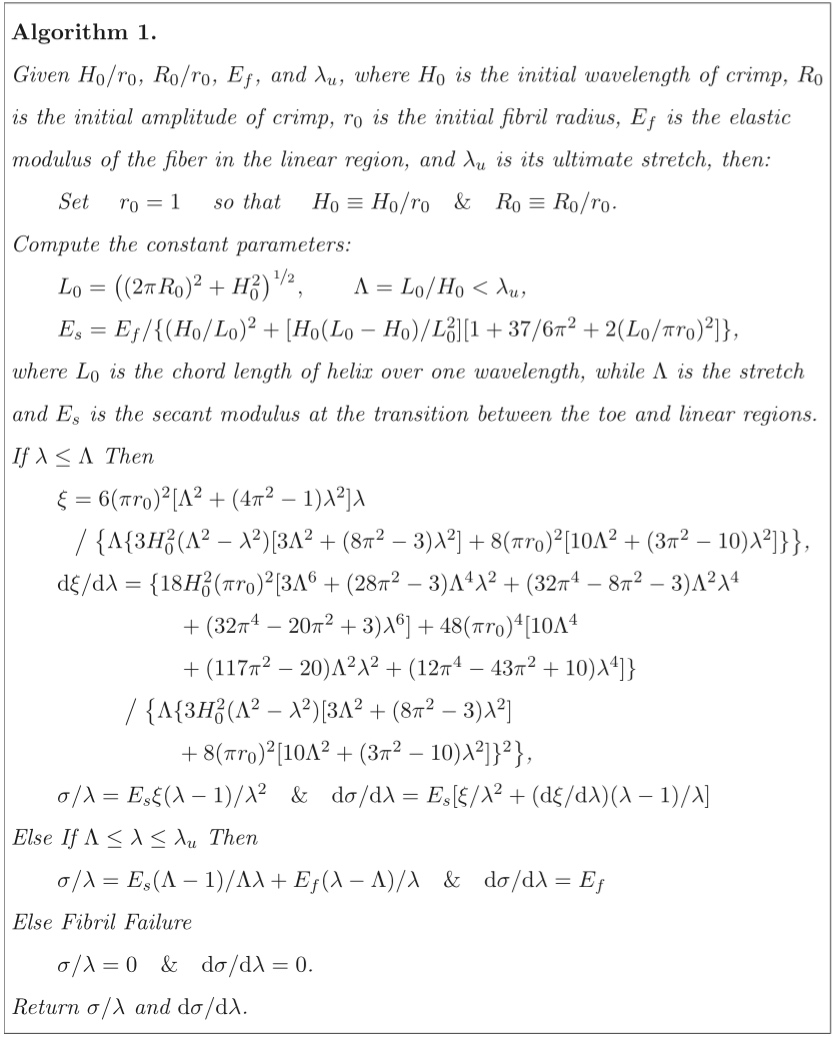 References1 Carson, J. P., A. P. Kuprat, X. Jiao, F. del Pin, and D. R. Einstein. An anisotropic fluid-solid model of the mouse heart. Comput. Cardiol. 36:377-380, 2009.2 Chandran, K. B. and H. Kim. Computational mitral valve evaluation and potential clinical applications. Annal. Biomed. Eng. 43(6):1348-1362, 2015. 3 Cochran, R. P. and K. S. Kunzelman. Effect of papillary muscle position on mitral valve function: relationship to mitral homografts. Annal. Thorac. Surg., 66(Suppl):S155- S161, 1998. 4 Couprie, C., L. Grady, L. Najman, and H. Talbot. Power watersheds: a new image segmentation framework extending graph cuts, random walker and optimal span- ning forest. in International Conference on Computer Vision, 2009. 5 Couprie, C., L. Grady, L. Najman, and H. Talbot. Power watersheds: a unifying graph-based optimization frame- work. IEEE Trans. Pattern Anal. Mach. Intell. 33(7):1384- 1399, 2010. 6 Einstein, D. R., F. DelPin, X. Jiao, A. P. Kuprat, J. P. Carson, K. S. Kunzelman, R. P. Cochran, J. M. Guccione, and M. B. Ratclifee. Fluid-structure interactions of the mitral valve and left heart: comprehensive strategies, past, present, and future. Int. J. Numer. Methods Biomed. Eng. 26(3-4):348-380, 2010. 7 Einstein, D., X. Jiao, and A. Kuprat. BioGeom: an inte- grated environment for geometric computations in bio- medicine. URL: https://simtk.org/home/biogeom. 8 Einstein, D. R., K. S. Kunzelman, P. G. Reinhall, M. A. Nicosia, and R. P. Cochran. The relationship of normal and abnormal microstructural proliferation to the mitral valve closure sound. Trans. ASME 127:134-147, 2005. 9 Einstein, D. R., P. G. Reinhall, K. S. Kunzelman, and R. P. Cochran. Nonlinear finite element analysis of the mitral valve. J. Heart Valve Dis. 3:376-385, 2005. 10 Freed, A. D., D. R. Einstein, and I. Vesely. Invariant for- mulation for dispersed transverse isotropy in aortic heart valves: an efficient means for modeling fiber splay. Bio- mech. Model Mechanobiol. 4:100-117, 2005. 11 He, S., J. D. Lemmon, M. W. Weston, M. O. Jensen, R. A. Levine, and A. P. Yoganathan. Mitral valve compensation for annular dilatation: in vitro study into the mechanisms of functional mitral regurgitation with an adjustable annulus model. J. Heart Valve Dis.8:294-302, 1999. 12 Ingels, Jr. N. B., and M. Karlsson. Mitral valve mechanics. Dropbox https://www.dropbox.com/sh/lbd9l7pl9cj8s1o/A ADp8vFqWboXXsn0P4wTKgjNa Chapter 22, 2014. 13 Jensen, M. O., A. A. Fontaine, and A. P. Yoganathan. Improved in vitro quantification of the force exerted by the papillary muscle on the left ventricular wall: three-dimen- sional force vector measurement system. Annal. Biomed. Eng., 29: 406-412, 2001. 14 Jensen, H., M. O. Jensen, and M. H. Smerup. Three-di- mensional assessment of papillary muscle displacement in a porcine model of ischemic mitral regurgitation. J. Thorac. Cardiovasc. Surg. 140:1312-1318, 2010. 15 Kunzelman, K. S. and R. P. Cochran. Stress/strain char- acteristics of porcine mitral valve tissue: parallel versus perpendicular collagen orientation. J. Cardiac Surg. 7(1):71-78, 1992. 16 Kunzelman, K. S., R. P. Cochran, C. J. Chuong, W. S. Ring, E. D. Verier, and R. C. Eberhart. Finite element analysis of the mitral valve. J. Heart Valve Dis. 2:326-340, 1993. 17 Kunzelman, K. S., R. P. Cochran, C. J. Chuong, W. S. Ring, E. D. Verier, and R. C. Eberhart. Finite element analysis of mitral valve pathology. J. Long Term Eff. Med. Implant 3:161-179, 1993. 18 Kunzelman, K. S., D. R. Einstein, and R. P. Cochran. Fluid-structure interaction models of the mitral valve: function in normal and pathological states. Philos. Trans. R. Soc. B, 362:1393-1406, 2007. 19 Kunzelman, K.S., M. S. Reimink, and R. P. Cochran. Annular dilatation increases stress in the mitral valve and delays coaptation: a finite element computer model. Cardiovasc. Surg. 5:427-434, 1997. 20 Kunzelman, K.S., M. S. Reimink, and R. P. Cochran. Flexible versus rigid ring annuloplasty for mitral valve annular dilation: a finite element model. J. Heart Valve Dis., 7:108-116, 1998. 21 Kunzelman, K.S., M. S. Reimink, E. D. Verier, and R. P. Cochran. Replacement of mitral valve posterior chordae tendineae with expanded polytetrafluoroethylene suture: a finite element study. J. Card. Surg. 11:136-145, 1996. 22 Kuprat, A. P. and D. R. Einstein. An anisotropic scale- invariant unstructured mesh generator suitable for volu- metric imaging data. J. Comput. Phys. 228:619-640, 2009. 23 Kuprat, A., A. Khamayseh, D. George, and L. Larkey. Volume conserving smoothing for piecewise linear curves, surfaces, and triple lines. J. Comput. Phys. 172: 99-118, 2001. 24 Lau, K. D., V. Diaz, P. Scambler, and G. Burriesci. Mitral valve dynamics in structural and fluid-structure interaction models. Med. Eng. Phys. 32:1057-1064, 2010. 25 Lee, C. -H., J.- P. Rabbah, A. P. Yoganathan, R. C. Gorman III, J. H. Gorman, and M. S. Sacks. On the effects of leaflet microstructure and constitutive model on the closing behavior of the mitral valve. Biomech. Model Me- chanobiol. 2015. doi:10.1007/s10237-015-0674-0. 26 Magne, J., M. Senechal, J. G. Dumesnil, and P. Pibarot. Ischemic mitral regurgitation: a complex multifaceted disease. Cardiology 112:244-259, 2009. 27 Maisano, F., A. Redaelli, M. Soncini, E. Votta, L. Arcobasso, and O. Alfieri. An annular prosthesis for the treatment of functional mitral regurgitation: finite element model analysis of a dog bone-shaped ring prosthesis. Ann. Thorac. Surg. 79:1268-1275, 2005. 28 Mansi, T., I. Voigt, B. Georgescu, X. Zheng, E. A. Men- gue, M. Hackl, R. Ionasec, T. Noack, J. Seeburger, and D. Comaniciu. An integrated framework for finite-element modeling of mitral valve biomechanics from medical images: application to mitralclip intervention planning. Med. Image Anal. 16:1330-1346, 2012. 29 Mansi, T., I. Voigt, E. A. Mengue, R. Ionasec, B. Ge- orgescu, T. Noack, J. Seeburger, and D. Comaniciu, Medical Image Computing and Computer-Assisted Intervention, chapter Towards Patient-Specific Finite-Element Simulation of MitralClip Procedure, Springer Berlin, Heidelberg, 2011. 30 Pouch, A. M., P. A. Yushkevich, B. M. Jackson, A. S. Jassaar, M. Vergnat, J. H. Gorman, R. C. Gorman, and C. M. Sehgal. Development of a semi-automated method for mitral valve modeling with medial axis representation using 3d ultrasound. Med. Phys. 39(2):933-950, 2012. 31 Prot, V., R. Haaverstad, and B. Skallerud. Finite element analysis of the mitral apparatus: annulus shape effect and chordal force distribution. Biomech. Model. Mechanobiol. 8(1):43-55, 2009. 32 Rabbah, J.-P., N. Saikrishnan, and A. P. Yoganathan. A novel left heart simulator for the multi-modality charac- terization of native mitral valve geometry and fluid mechanics. Ann. Biomed. Eng. 41(2):305-315, 2013. 33 Rahmani, A., A. Q. Rasmussen, J. L. Honge, B. Ostli, R. A. Levine, A. Hagege, H. Nygaard, S. L. Nielsen, and M. O. Jensen. Mitral valve mechanics following posterior leaflet patch augmentation. J. Heart Valve Dis. 22(1):28-35, 2013. 34 Reimink, M. S., K. S. Kunzelman, and R. P. Cochran. The effect of chordal replacement suture length on function and stresses in repaired mitral valves: a finite element study. J. Heart Valve Dis. 5:365-375, 1996. 35 Reimink, M. S., K. S. Kunzelman, E. D. Verier, and R. P. Cochran. The effect of anterior chordal replacement on mitral valve function and stresses. ASAIO Trans. 41:M754- M762, 1995. 36 Rim, Y., S. T. Laing, D. D. McPherson, and H. Kim. Mitral valve repair using eptfe sutures for ruptured mitral chordae tendineae: a computational simulation study. Ann. Biomed. Eng. 42(1): 139-148, 2013. 37 Sacks, M. S. Incorporation of experimentally-derived fiber orientation into a structual constitutive model for planar collagenous tissues. J. Biomech. Eng. 125(2):280-287, 2003. 38 Schievano, S., K. S. Kunzelman, M. A. Nicosia, R. P. Cochran, D. R. Einstein, S. Khambadkone, and P. Bon-hoeffer. Percutaneous mitral valve dilatation: single balloon versus double balloon. A finite element study. J. Heart Valve Dis., 18:28-34, 2009. 39 Stevanella, M., F. Maffessanti, C. A. Conti, E. Votta, A. Arnoldi, M. Lombardi, O. Parodi, E. G. Caiani, and A. Redaelli. Mitral valve patient-specific finite element modeling from cardiac mri: application to an annuloplasty procedure. Cardiovasc. Eng. Technol. 2(2):66-76, 2011. 40van Rijk-Zwikker, G. L., B. J. Delemarre, and H. A. Huysmans. Mitral valve anatomy and morphology: rele- vance to mitral valve replacement and valve reconstruction. J. Card. Surg. 9(2 Suppl):255-261, 1994. 41 Votta, E., E. G. Caiani, F. Veronesi, M. Soncini, F. M. Motevecchi, and A. Redaelli. Mitral valve finite-element modelling from ultrasound data: a pilot study for a new approach to understand mitral function and clinical scenarios. Philos. Trans. Ser. A 366(1879):3411-3434, 2008. 42 Votta, E., T. B. Le, M. Stevanella, L. Fusini, E. G. Caiani, A. Redaelli, and F. Sotiropoulos. Toward patient-specific simulations of cardiac valves: state-of-the-art and future directions. J. Biomech. 46(2):217-228, 2013. 43 Wenk, J. F., Z. Zhang, G. Cheng, D. Malhotra, G. A.-Bolton, M. Burger, T. Suzuki, D. A. Saloner, A. W. Wallace, J. M. Guccione, and M. B. Ratclifee. First finite element model of the left ventricle with mitral valve: insights into ischemic mitral regurgitation. Ann. Thorac. Surg. 89:1546-1554, 2010. |

Contact Us
Phone
+1-516-686-3765
Address
Dept. of Osteopathic Manipulative Medicine
College of Osteopathic Medicine
New York Institute of Technology
Serota Academic Center, room 138
Northern Boulevard, P.O. Box 8000
Old Westbury, NY 11568
mtoma@nyit.edu