

Message
Message
|
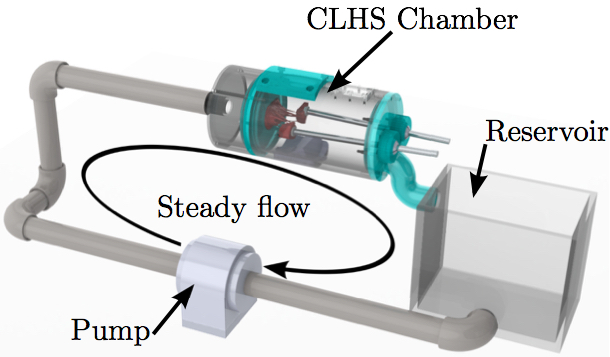
doi: 10.1007/s10237-016-0786-1 High-resolution subject-specific mitral valve imaging and modeling: experimental and computational methodsAbstractThe diversity of mitral valve (MV) geometries and multitude of surgical options for correction of MV diseases necessitates the use of computational modeling. Numerical simulations of the MV would allow surgeons and engineers to evaluate repairs, devices, procedures, and concepts before performing them and before moving on to more costly testing modalities. Constructing, tuning, and validating these models rely upon extensive in vitro characterization of valve structure, function, and response to change due to diseases. Micro-computed tomography (µCT) allows for unmatched spatial resolution for soft tissue imaging. However, it is still technically challenging to obtain an accurate geometry of the diastolic MV. We discuss here the development of a novel technique for treating MV specimens with glutaraldehyde fixative in order to minimize geometric distortions in preparation for µCT scanning. The technique provides a resulting MV geometry which is significantly more detailed in chordal structure, accurate in leaflet shape, and closer to its physiological diastolic geometry. In this paper, computational fluid-structure interaction (FSI) simulations are used to show the importance of more detailed subject-specific MV geometry with 3D chordal structure to simulate a proper closure validated against µCT images of the closed valve. Two computational models, before and after use of the aforementioned technique, are used to simulate closure of the MV.1. IntroductionThe MV is located between the left atrium (LA) and left ventricle (LV) of the heart, passively enforcing one-way flow of oxygenated blood through the left heart from the lungs to the body. The MV is made up of two asymmetric leaflets that are attached to the mitral annulus. Chordae tendineae attach the free edge of mitral leaflets to the walls of the LV via papillary muscles (PMs), and facilitate proper closure of the MV when the LV contracts. This prevents the backward flow of blood into the atrium (known as mitral regurgitation) and forces ejection of blood into the aorta during systole. Ischemic mitral regurgitation occurs when ischemic remodeling of the LV perturbs the complex geometry of the MV apparatus since remodeling can lead to PMs displacement, causing improper valve closure. A plethora of surgical techniques and devices exist to attempt to restore proper MV geometry and function. However, deeper understanding of the healthy MV structure and the functional contributions of its components is still lacking. Computational models of the MV provide a platform to examine the function of the healthy MV, and, additionally, the ability to systematically perturb the MV structure, and examine the effects at an unprecedented level of detail in comparison with in vitro and in vivo models. In light of the mechanotransductive nature of valve tissue remodeling processes (Balachandran et al. 2010; Connell et al. 2015), post-simulation stress estimation may provide an insight into long-term tissue remodeling potential. Ultimately, computational modeling of the MV should be a new tool to assist clinicians and engineers in understanding various aspects of MV function, and predicting the functionality and durability of potential repair techniques (Chandran and Kim 2015).Pioneering work in the space of computational valve modeling began with the structural finite element modeling of idealized valvular geometries (Rim et al. 2013; Mansi et al. 2012; Einstein et al. 2010; Schievano et al. 2009; Wenk et al. 2010; Maisano et al. 2005; Stevanella et al. 2011; Mansi et al. 2011; Lau et al. 2010; Prot et al. 2009; Votta et al. 2013; Kunzelman et al. 1998). In recent years, focus has moved to highly detailed, patient-specific modeling. However, the development of these highly detailed models is dependent on cutting edge imaging modalities. Capturing anatomically accurate 3D images of the MV is the critical first step of any MV modeling endeavor. In the case of our group's ongoing analyses of the MV, finite element analysis was introduced three decades ago to begin to understand the mechanical stresses in the valve in normal (Kunzelman et al. 1993; Toma et al. 2015), diseased (Kunzelman et al. 1993, 1997, 1998), and surgically repaired states (Cochran and Kunzelman 1998; Reimink et al. 1995; Kunzelman et al. 1996; Reimink et al. 1996). An anatomically realistic computational model of the MV that includes leaflets, papillary muscles, and chordal 3D elements, based on µCT images of a normal valve, has now been developed and validated with a particular focus on determining the resulting forces on the chordae tendineae throughout the cardiac cycle (Toma et al. 2015). In this work, we describe a novel MV preparation methodology used in combination with µCT imaging, which yields detailed, anatomically accurate 3D images of excised ovine MVs. We then describe the process of developing an FSI model of the MV and illustrate the importance of MV geometry by comparing performance of 3D MV geometries obtained before and after the aforementioned MV treatment methodology prior to µCT imaging. 2. METHODS2.1 Experimental setupLocally sourced, to avoid rigor mortis development, ovine MVs were first excised and then mounted onto the annulus plate of a pulsatile cylindrical left heart simulator (CLHS) (Rabbah et al. 2013). Ultrasound imaging (Philips iE33 xMATRIX, Philips Healthcare, Andover, MA) was used to view valve closure parameters under pulsatile flow. Papillary muscle (PM) positions were then adjusted to achieve healthy closure according to commonly used parameters (anterior leaflet occupying 2/3 of the AP diameter, coaptation height of 3-5 mm, minimal tenting and prolapse, MR volume <5 ml). The PM positions were then recorded, and the chamber was dismounted from the pulse duplicator in preparation for µCT imaging. All imaging was done by an Inveon µCT scanner (Siemens Medical Solutions USA, Inc., Malvern, PA) optimized to image soft tissue (80 kV energy, 500 µA intensity, 650 ms integration time) at 43.29 µm isotropic voxel resolution.2.2 micro-CT imaging in the diastolic configurationTo capture the physiological diastolic detail of the MV, we developed a preparation method which preserves physiological leaflet area and mitigates some sources of geometric error when scanning a MV with µCT in air. The largest source of initial error appeared to be the surface tension caused by residual moisture on the valve apparatus. This phenomenon caused a "bunching" effect on the leaflets and chordae tendineae, which yielded 3D datasets in which the leaflets appeared smaller and thicker, and the delicate chordal trees appeared as bulky chordae with minimal branching.More severe folding was observed in the thin, aqueous marginal section than in the thicker, more collagenous basal section of the anterior leaflet. This agrees with the prediction that bending stiffness in thin tissue would be lower than in thicker tissue. In the chordae tendineae, the bending stiffness was lower in sections with a smaller cross-sectional area, and thus, bunching was more extreme. It was hypothesized that the well-characterized stiffening effects of glutaraldehyde fixation (Vesely and Boughner 1989) would counteract this bunching effect caused by surface tension, and thus, a fixation technique was developed for this purpose.
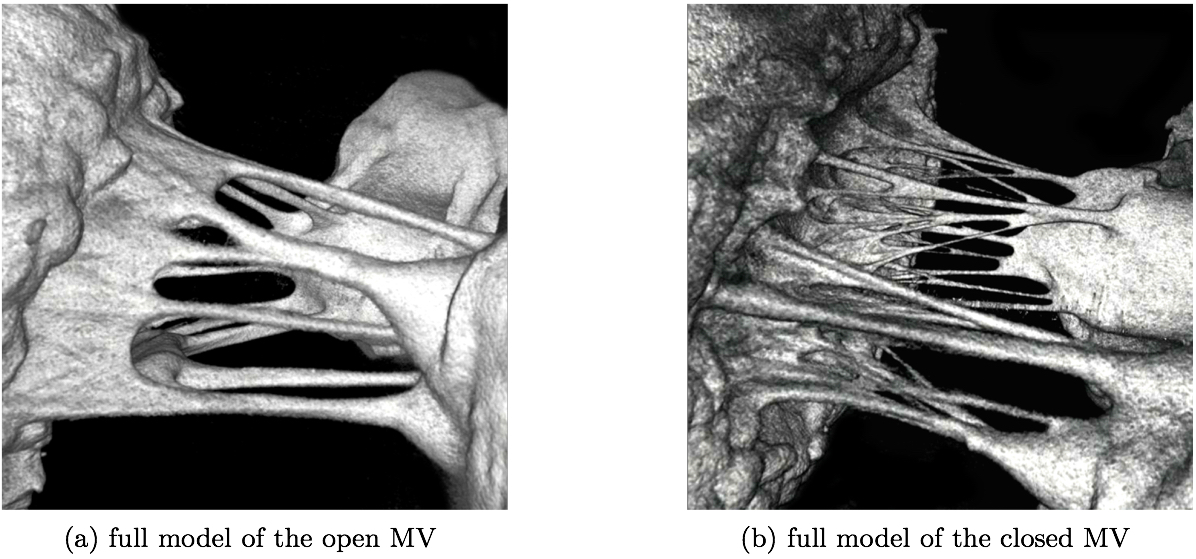
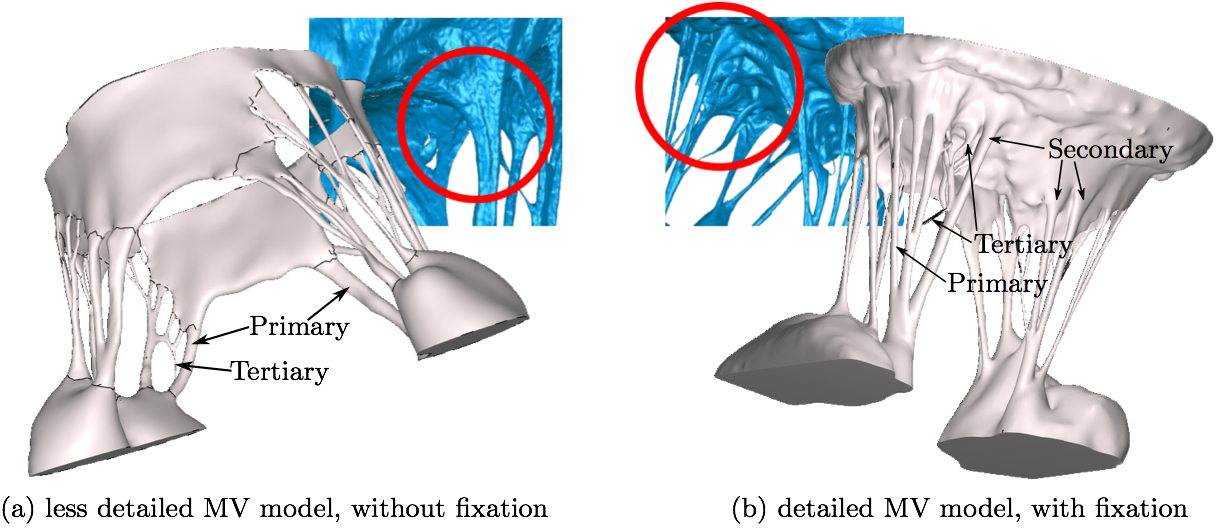
2.3 micro-CT imaging in the systolic configurationAs a means to validate the closure achieved in the computational models created using the diastolic geometries, each MV was also imaged in its systolic state prior to fixation. To pressurize the MV to systolic levels, the CLHS is first sealed and then attached to a compressor. An in-line pressure reg- ulator was used to adjust and monitor the pressure in the ventricular chamber of the CLHS, while an in-line humidi- fier was implemented to keep the MV moist. The MV was closed and pressurized to a peak systolic pressure (120 ± 1 mmHg), which was maintained for the duration of the scan (6 minutes). Figure 2 illustrates the resulting geometry of the open MV without treatment (Fig. 2a). After imaging the systolic geometry by µCT, the detail in the chordae tendinea could be seen (Fig. 2b).
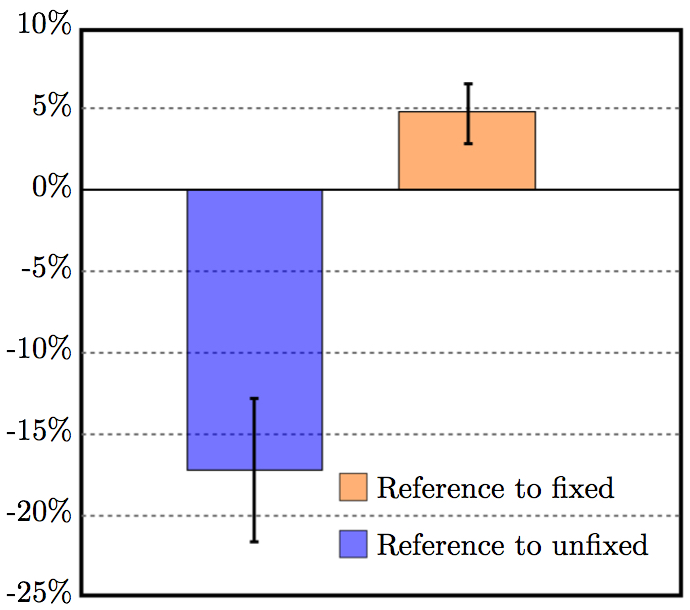
2.4 Soft tissue trackingTo verify the result of fixation, a novel µCT deformation tracking technique developed by our group was implemented (Pierce et al. 2015). Briefly, non-interfering high-contrast glass markers (average diameter ≈700 µm) were affixed in a 2-mm grid pattern to the MV leaflet surfaces prior to µCT imaging. The centroids of these markers were found in post-processing after µCT imaging, enabling leaflet area change calculations between µCT scans under different loading conditions.To verify that leaflet area was unchanged, the fixation treatment was performed for four (n = 4) ovine MVs. Since surface tension on the MV is eliminated when the MV is completely submerged in water, this 'submerged' state was chosen as a reference configuration. When imaging the submerged valve by µCT, the valve apparatus cannot be distinguished from the water, so the scan could not be used to obtain the MV geometry for modeling purposes. However, high-contrast markers on the leaflet surface were visible in this submerged condition. After affixing markers to the surface of the MV leaflets, the CLHS was sealed, filled with water, and imaged. The CLHS was then drained, and the MV was imaged unloaded in air in an 'unfixed' diastolic state. Finally, the MV was fixed using the aforementioned light glutaraldehyde fixation technique and imaged in air in the 'fixed' state. Leaflet area change was computed between the 'reference' and 'unfixed' states, and between the 'reference' and 'fixed' states. 2.5 Constitutive modelThe constitutive model for the material properties utilized a three-dimensional splay invariant, based on an approximation of a three-dimensional Gaussian distribution of fibers (Freed et al. 2005). The model is defined in terms of a strain energy function given in Freed et al. (2005). For brevity, we present here the second Piola-Kirchhoff stress, S, as follows
where J is Jacobian, κ is bulk modulus, σi is passive fiber stress-strain rule for the ith (1 or 2) fiber population, ε is active fiber stress-strain rule, Dev is deviatoric projection operator, and C is right-Cauchy deformation, and λi is dispersed fourth invariant defined as
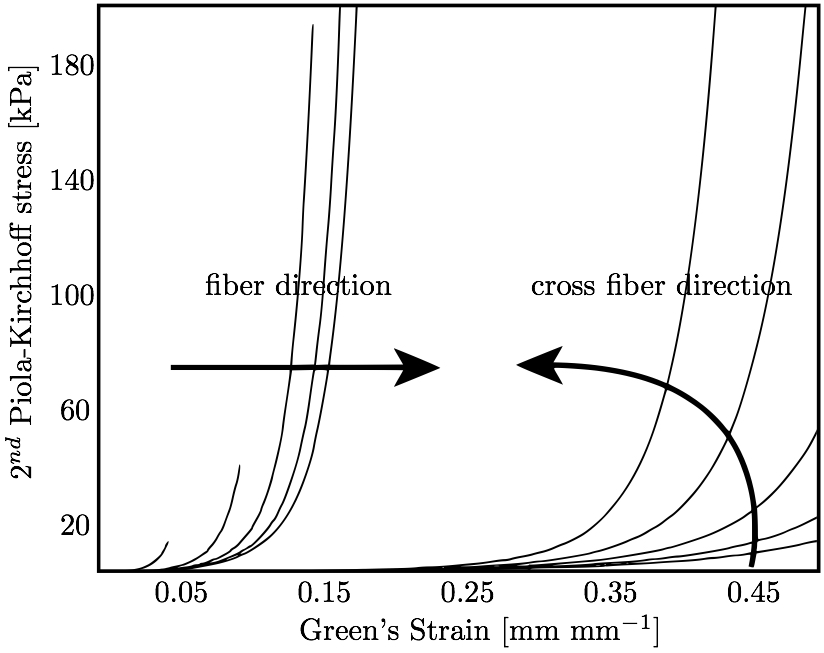
where C is the isochoric part of the right-Cauchy deformation and K is called the dispersion tensor or anisotropy tensor and is given in global coordinates; note, as K embodies the concept of dispersion, λ is not a stretch in a classical sense. The matrix K is governed by splay parameters described in Freed et al. (2005). The biaxial stress-strain behavior of the mitral leaflets (Fig. 3a) is characterized by the structural constitutive equation.
Specific parameter values used in this model are given below. For all structures, the bulk modulus, κ, was set to 2.80 × 10⁴ kPa; note the 'true' value is in the range of 2.80 × 10⁷ kPa but was reduced to increase the time step. The isotropic parameter μ was 10.0 kPa, and the fiber stiffness Ef was 4.8 × 10⁴ kPa. Dimensionless parameters H0/r0 and R0/r0 were 14.5 and 1.75 for the anterior leaflet, 7.0 and 1.0 for the posterior leaflet, and 8900.0 and 25.0 for the papillary muscles. For all chordae, R0/r0 was 5.0. H0/r0 varied for most chordae, ranging from 1.35 for the strut chordae to 90 for the marginal chords. 2.6 Fiber orientationThe mitral leaflet tissue material behavior (Eq. 1) is characterized as an oriented entangled population of crimped collagen fibers embedded in an isotropic phase of gel-like glycoproteins and a network of isotropic elastin (Fig. 3) (Kunzelman et al. 2007; Einstein et al. 2005).Determination of collagen fiber orientation in the mitral valve is both critical and challenging. Currently, no perfect method exists for the comprehensive experimental measurement of the three-dimensional collagen architecture that includes all of the substructures of the mitral valve. Two-dimensional characterization that focuses on the leaflets unfolded into a plane has been carried out with small angle light scattering (SALS) (Kunzelman and Cochran 1992; Sacks 2003). Recent efforts have been made to map 2D SALS data to 3D image-derived models (Lee et al. 2015), using control points and interpolation. However, these mappings exclude the mitral valve chordae and artifacts from excision such as the relaxation of collagen fibers and subsequent re-orientation remain. An added challenge is how to determine fiber orientations noninvasively. The approach we have adopted is best described as a geometric technique that is subject to experimentally determined boundary conditions. It too is not perfect, but it does have some advantages: it is fast, it is fundamentally three-dimensional, it requires no invasive experimental techniques, and it accommodates a realistic transition between chordae and leaflets. The gist of the method is that we have some certainty with respect to some areas of alignment. These are our boundary conditions. For example, we know that the fiber orientation is mostly aligned with the axis of the chordae, and the free edges of the leaflets. We also know that fiber directions will be approximately in the plane of the leaflets. From our previous SALS studies of fiber orientation (Kunzelman and Cochran 1992), we know that fibers will be oriented approximately vertically at the fibrous trigones, and approximately circumferentially along the annulus at the midpoints of the anterior and posterior leaflets. Lastly, we assume that to be mechanically optimal the fiber field must be slowly varying between these fixed directions. Thus, we solve a modified Laplace problem to determine the unspecified fiber directions in between. More specifically, let Ω be the volume over which fiber orientations need be determined, and S be the set of seed points where the fiber directions d^ are known. We solve Laplace's equation for the 3x3 matrix M over Ω with Dirichlet boundary data constructed from d^:
Note that we must solve for M(x)=(d^)(d^)T rather than the fiber direction itself d^ to negate the confounding effect of polarity. In other words, we wish, for example, to treat <1,0,0> as the same direction as <-1,0,0>. The solution M(x) over Ω\S is then decomposed into an eigenvalue decomposition:
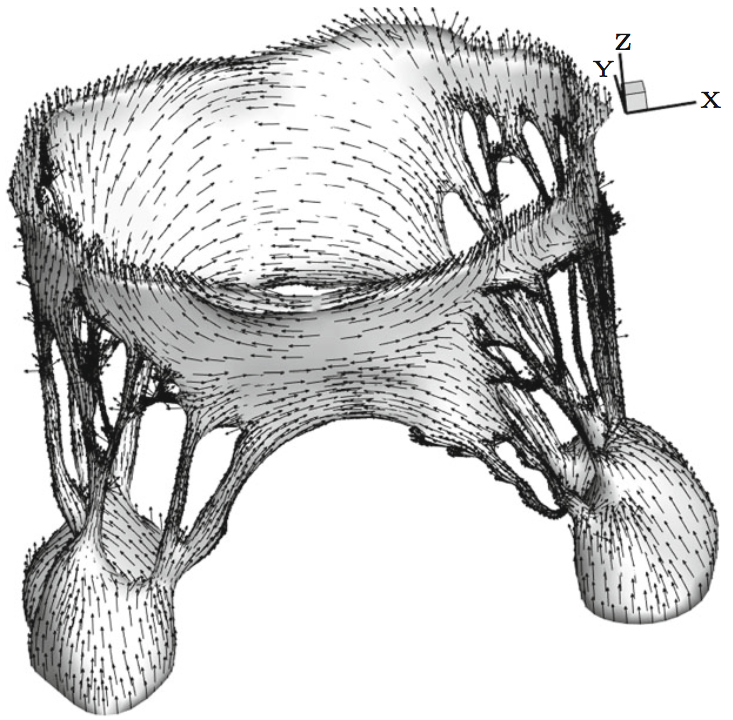
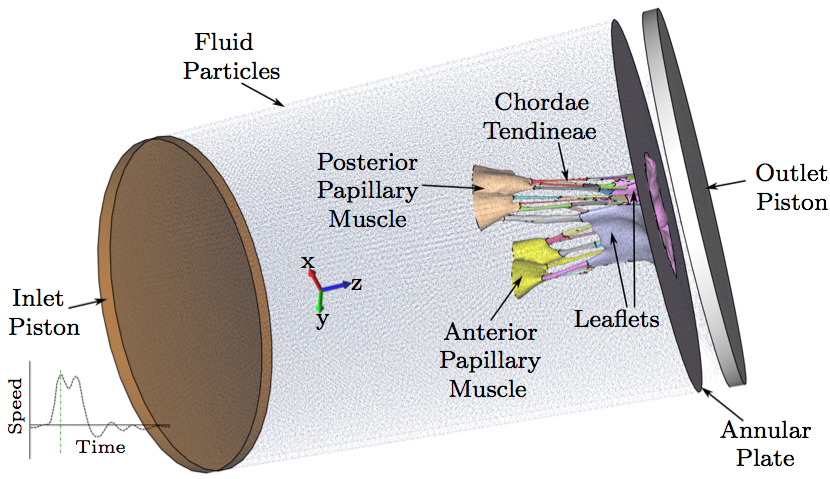
with λ1 >= λ2 >= λ3 >= 0. The first (orthonormal) column vector e1 in E is taken to be the fiber direction at each point x in Ω\S, where the eigenvalue solution simply unpacks the square matrix M. 2.7 FSI computational modelThe model was developed using the μCT datasets, followed by image processing, mesh generation, and finally, valve closure simulation using an FSI approach. These steps are described in detail in previously published work by our group (Toma et al. 2015). Briefly, a simple threshold was first applied to each μCT image, and a triangulated surface of the valve was extracted. Next, the geometry was separated into sections based on the physiology of the valve, allowing material properties to be mapped individually to each section. A layered tetrahedral grid was then generated within the sur- face, such that at least three layers of elements were formed in the leaflet thickness. Collagen fiber alignment was mapped to the valve geometry using experimental data on alignment at discrete points in the valve geometry (trigones, chordal insertions, leaflet edges, and annular points). The material model incorporated anisotropic stiffness given fiber direction, and fiber splay based on the three-dimensional Gaussian fiber distribution. This model is discussed extensively in previously published work (Toma et al. 2015). Here, two computational models, with and without the use of the fixation technique, were used to simulate closure of the MV.Various approaches have been adopted to address the challenge of modeling valve function using FSI. In this study, we adopted an approach based on smoothed particle hydrodynamics (SPH), wherein the fluid is modeled as a collection of discrete particles (Liu and Liu 2003). Fluid motion and boundary interaction were solved with the IMPETUS Afea SPH Solver, while large deformation in the solid MV was simultaneously solved with the IMPETUS Afea Solver. Both the solvers use GPU parallel processing, thus avoiding the need for a large computer cluster. All solid elements were fully integrated, removing the possibility of hourglass modes and element inversion that plagues the classic under-integrated elements. Both fluid and solid domains, and their interaction, were solved with an explicit integration scheme. All simulations were solved on a standard workstation. Parallel acceleration was achieved with a Tesla K40 GPU with 12 GB of Graphic DDR memory and 2880 CUDA Cores. To confirm that convergence was reached, refinement and coarsening of the finite element mesh (h-refinement) were performed. After testing meshes of three different resolutions (92,612 elements, ±20%), all solutions were found to converge to within 5% of each other. The fluid particles were confined in a pipelike rigid structure surrounding the model, and two pistons moved within the pipe at prescribed velocity (Fig. 4). The nodes at the bottom of the papillary muscles were fixed in all three directions, as well as the nodes on the annular attachment.
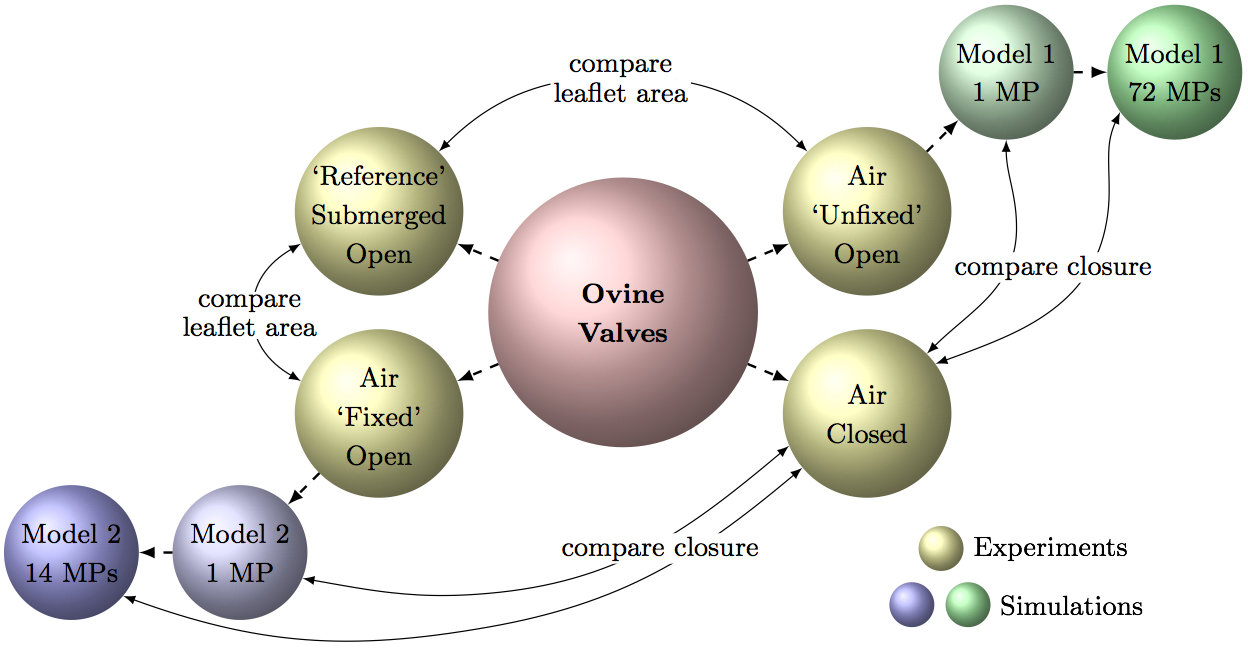
2.8 Methods summaryTo clarify the above methods and resulting comparisons used in this work, Fig. 5 summarizes all the different valve scans and comparisons that are made to consequently draw conclusions. In total, four types of μCT scans were conducted: two (Air Unfixed Open, Air Fixed Open) were used as computational model inputs, one (Air Closed) was used for computational model verification after simulated closure, and one (Submerged Open) was used to verify the fixation technique.
3. RESULTS3.1 Comparison of diastolic MV geometriesMore detail in the chordal tree was seen in the resulting μCT images after treatment of the MV with the aforementioned fixation technique. The smaller marginal chordae could be resolved from the strut chordae from which they branch, yielding a 3D image that captures the finer detail of the sub- valvular apparatus (Fig. 6).
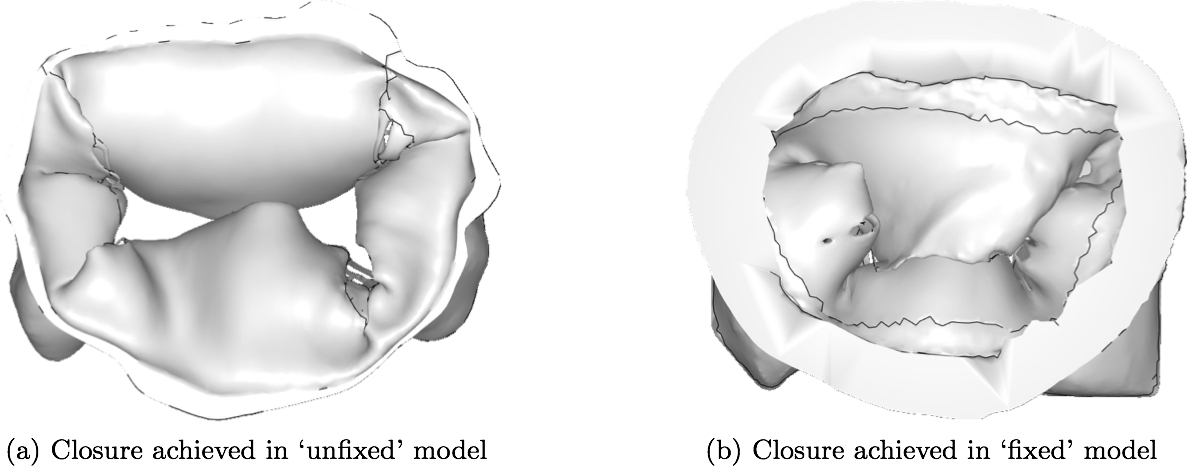
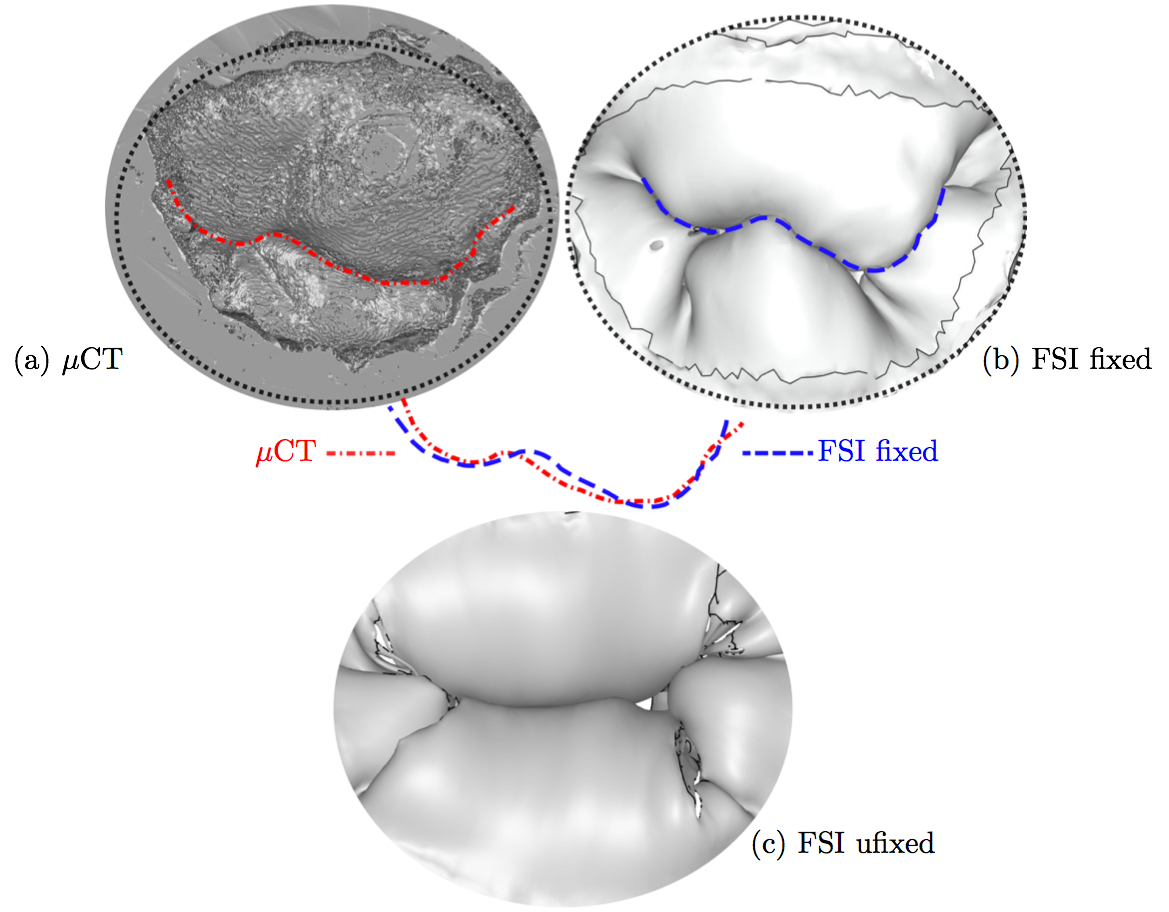
3.2 Closure simulationThe resulting computational models created from the μCT images with and without the use of fixation technique are shown in Fig. 6. For comparison purposes, a single isotropic material property (Kunzelman and Cochran 1992) was assigned to both of these models in their entirety, and closure was simulated using FSI (Fig. 8). It can be seen that the loss of geometric accuracy (especially the secondary chordae) in the 'unfixed' model caused insufficient closure of the leaflets compared to the 'fixed' model, where more chordal detail was preserved. Though closure was significantly better in the 'fixed' model, some inaccuracies remained for the two commissural segments, where chordal detail was still lacking.
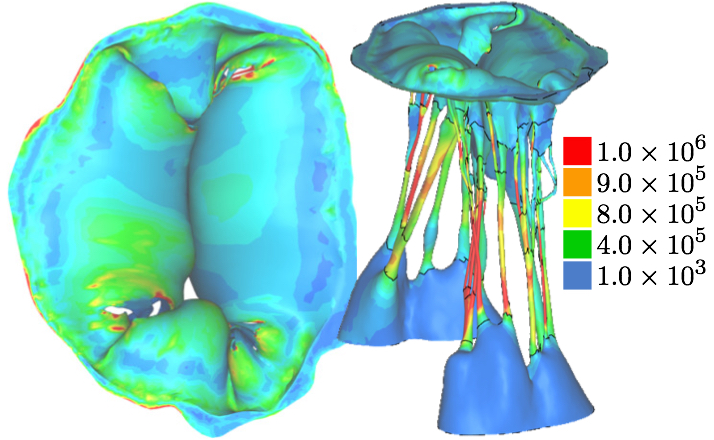
3.3 Optimizing closure simulation using the 'unfixed' modelAfter simulating closure of the unfixed model using a single material property, the model was segmented into 72 regions depending on their robustness with the focus on obtaining a full closure. Material properties were individually assigned to each of the 72 regions, which were segmented according to single chordal lengths and leaflet regions. The material properties for each region were determined based on the visual observation of the resulting closure; in order to reach a relatively sufficient closed geometry, the stiffness in individual parts of the chordal structure was adjusted. This subject-specific inverse finite element characterization of chordal and leaflet properties resulted in the closure geometry that is shown in Fig. 9, with a heat map of the first deviatoric principal stress. It shows that a relatively good closure, compared to model with single material property, could be reached after material properties were individually assigned to different parts of the model, especially the chordae tendinae. However, leakage gaps still remained near the right commissure; this was not the case in the μCT reconstruction of the closed configuration.
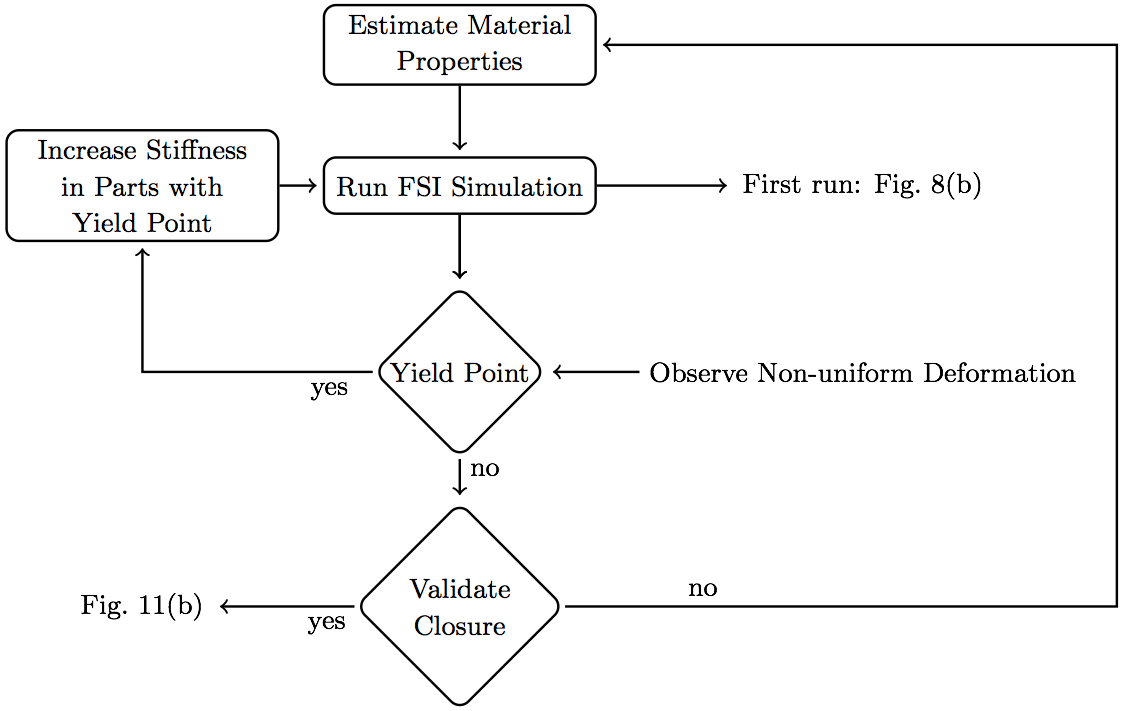
3.4 Optimizing closure simulation using the 'fixed' modelSimulated MV closure using the 'fixed' model was nearly sufficient without optimizing the chordal and leaflet properties individually (Fig. 8b). Therefore, a more controlled, semi-automated method of assigning material properties was adopted. Though the closure geometry was nearly physiological with just one material property, it was observed that loading was not uniform in the chordae tendineae, with high peak stress concentrated in a few regions, resulting in highly non-uniform deformation, especially in some of the smaller chordae. Therefore, using a custom, semi-automated MATLAB (MathWorks Inc., Natick, MA, USA) script, individually defined material properties were also assigned to chordal and leaflet segments in the 'fixed' model, albeit less extensively, as follows. Starting with published ranges for chordal and leaflet stiffness (Kunzelman and Cochran 1992), an iterative procedure was used to identify adequate material properties to reach closure without exceeding the yield strain (non-uniform deformation) in any part of the model (Fig. 10).
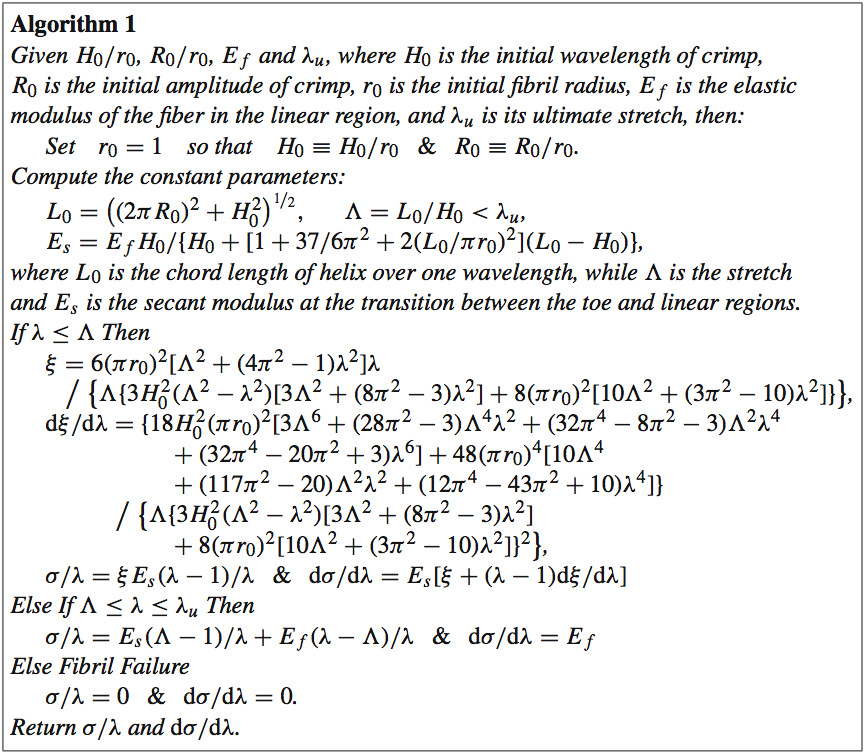
4. DISCUSSIONThe purpose of this work was to illustrate the use of detailed geometry of the mitral valve, and the impact of this detail on constructing robust and accurate computational models of the MV. We have shown that the surface tension of residual water on the MV can significantly affect the result of static μCT imaging in air, leading to 3D images with underrepresented leaflet area and chordal branching. In turn, this leads to computational simulations that do not achieve proper closure, are not robust, and depend highly on extensive material property tuning.A technique wherein glutaraldehyde fixation is used to counteract the effect of surface tension on the valve was developed and validated. As expected, the anterior leaflets of the 'unfixed' MVs shrank significantly (by 17%) compared to those of the 'reference' configuration MVs, confirming that surface tension was a main source of error. Fixation resolved this challenge, but actually overcompensated slightly; the anterior leaflets of our 'fixed' MVs stretched by 5% versus the 'reference' state. This likely resulted from the choice of reference configuration. While statically submerging the MV in saline eliminated adverse surface tension effects, it did not produce the leaflet stretching effect of diastolic filling. One approach to addressing this limitation may be utilization of 3D+t echocardiography to derive the 'reference' geometry under pulsatile flow. Work is underway with an additional cohort of valve samples to collect the necessary data for this validation step. Additionally, a modified fixation protocol, with a lower flow rate than the steady 20 L/min used herein, may lessen stretching effects. Following validation, the new experimental capability of accurately capturing valve geometries and mitigating geometric valvular distortion during static imaging not only has applications for the mitral valve, but can be applied to other valves and improve modeling ability in a broader sense. The combined effects of the improved accuracy in leaflet area with the more complete chordal branching network led to superior performance of the subsequent FSI models. Closure in the FSI models using this 'fixed' geometry was significantly more robust. The 'fixed' valve model's performance was even further enhanced by application of heterogeneous material properties, as expected. The material variation across the MV apparatus is well documented (Toma et al. 2015). Yet, in the 'unfixed' model, application of material heterogeneity could not salvage the MV closure. After a time-consuming and extensive material property characterization of the 'unfixed' model, simulations resulted in closure that showed weak resemblance to that of the validation μCT scan. However, material property characterization in the 'fixed' model resulted in closure that showed excellent agreement with that of the closed validation μCT scan. By using semi-automated tuning methods and allowing the valve geometry to reach its healthy closure independent of manual manipulation, the model can be trusted to also accurately represent altered pathophysiological states of closure. Work is ongoing to simulate these pathophysiological states both experimentally and computationally, to assess the ability of these improved models to simulate altered states of function. With an ever-widening array of MV repair techniques at the mitral surgeon's disposal, an important application of MV models is prediction of repair performance. Recurrent MR post-repair is a persistent challenge for both degenerative (Flameng et al. 2008) and functionally diseased valves (McGee et al. 2004), which motivates development of tools to accurately predict repair durability. Progressive MV tissue remodeling plays an important role in MR recurrence (Flameng et al. 2008; Gillinov et al. 2008; Sacks et al. 2006); this complex mechanobiological process has been strongly linked to adverse tissue loading. Connell et al. recently showed that distortions in MV geometry alone (i.e., changes to slack in the chordae and/or annular area) can significantly alter MV cellular activity and extracellular composition (Connell et al. 2015). Our results demonstrate that prediction of closure geometry and stress distribution is intimately linked to input geometry, and the use of glutaraldehyde fixation provides more accurate input geometries and enables more accurate closure dynamics. The combination of these anatomically accurate, high-resolution μCT images of the MV with 3D subject-specific finite element models created from those images, and FSI simulation using those models broadens the scope of problems that heart valve modeling can target. For example, because 3D chordal trees are implemented in the model, chordal stress can be evaluated given different valve repair approaches. This is an application for which simplified 1D chordae models fall short. By enabling visualization and quantification of tissue stresses, computational simulation of MV closure holds great potential for predicting repair durability. Also, because FSI is used, highly dynamic diastolic MV function can be evaluated before and after a simulated repair. Models using only structural FE simulation cannot be used to simulate dynamic phenomena, especially when related to chordae tendinae. Capturing the full MV apparatus at a subject-specific level, while simulating both the fluid and structural domains of MV function, is computationally intensive. However, the use of SPH and the newest GPU technologies allows these simulations to be completed in a matter of hours, without the need for expensive computer clusters. Future work utilizing these computational and experimental methods will target systolic and diastolic performance of novel trans-catheter repair devices and procedures, as well as the effects that these devices have on load distribution in the MV apparatus. ACKNOWLEDGMENTSThis study was supported by a grant from the National Heart Lung and Blood Institute (R01-HL092926) and by a grant from the National Science Foundation Graduate Research Fellowship (DGE-1148903).APPENDIXThe 1D microstructural model, δ, is based on the physiology of crimped collagen fibers (Freed and Doehring 2005) that we have altered to meet our needs (see Algorithm 1); specifically, given a fiber stretch λ, this model returns the engineering stress δ/λ and tangent modulus dσ/dλ of the fiber. There are four physiologic parameters (material constants defined at the top of the algorithm) that the user must supply; three if failure is not to be considered.
REFERENCESBalachandran K, Sucosky P, Jo H, Yoganathan A (2010) Elevated cyclic stretch induces aortic valve calcification in a bone morphogenic protein-dependent manner. Am J Pathol 177(1):49-57Chandran K, Kim H (2015) Computational mitral valve evalua- tion and potential clinical applications. Ann Biomed Eng 43(6): 1348-1362 Cochran R, Kunzelman K (1998) Effect of papillary muscle position on mitral valve function: relationship to mitral homografts. Ann Thorac Surg 66(Suppl):S155-161 Connell P, Azimuddin A, Kim S, Ramirez F, Jackson M, Little S, Grande-Allen K (2015) Regurgitation hemodynamics alone cause mitral valve remodeling characteristic of clinical disease states in vitro. Ann Biomed Eng. doi:10.1007/s10439-015-1398-0 Einstein D, DelPin F, Jiao X, Kuprat A, Carson J, Kunzelman K, Cochran R, Guccione J, Ratclifee M (2010) Fluid-structure interactions of the mitral valve and left heart: comprehensive strategies, past, present, and future. Int J Numer Methods Biomed Eng 26(3- 4):348-380 Einstein D, Kunzelman K, Reinhall P, Nicosia M, Cochran R (2005) The relationship of normal and abnormal microstructural proliferation to the mitral valve closure sound. Trans ASME 127:134-147 Flameng W, Meuris B, Herijgers R, Herregods M-C (2008) Durability of mitral valve repair in barlow disease versus fibroelastic deficiency. Thorat Cardiovasc Surg 135(2):274-282 Freed A, Doehring T (2005) Elastic model for crimped collagen fibrils. J Biomech Eng 127(4):587-593 Freed A, Einstein D, Vesely I (2005) Invariant formulation for dis- persed transverse isotropy in aortic heart valves: an efficient means for modeling fiber splay. Biomech Model Mechanobiol 4: 100-117 Gillinov A, Cosgrove D, Blackstone E, Diaz R, Arnold J, Lytle B, Smedira N, Sabik J, McCarthy P, Loop F (2008) Durability of mitral valve repair for degenerative disease. J Thorac Cardiovasc Surg 116(5):734-743 Kunzelman K, Cochran R (1992) Stress/strain characteristics of porcine mitral valve tissue: parallel versus perpendicular collagen orienta- tion. J Card Surg 7(1):71-78 Kunzelman K, Cochran R, Chuong C, Ring W, Verier E, Eberhart R (1993a) Finite element analysis of mitral valve pathology. J Long Term Eff Med Implants 3:161-179 Kunzelman K, Cochran R, Chuong C, Ring W, Verier E, Eberhart R (1993b) Finite element analysis of the mitral valve. J Heart Valve Dis 2:326-340 Kunzelman K, Einstein D, Cochran R (2007) Fluid-structure interaction models of the mitral valve: function in normal and pathological states. Philos Trans R Soc B 362:1393-1406 Kunzelman K, Reimink M, Cochran R (1997) Annular dilatation increases stress in the mitral valve and delays coaptation: a finite element computer model. Cardiovasc Surg 5:427-434 Kunzelman K, Reimink M, Cochran R (1998) Flexible versus rigid ring annuloplasty for mitral valve annular dilation: a finite element model. J Heart Valve Dis 7:108-116 Kunzelman K, Reimink M, Verier E, Cochran R (1996) Replacement of mitral valve posterior chordae tendineae with expanded polytetrafluoroethylene suture: a finite element study. J Card Surg 11:136-145 Lau K, Diaz V, Scambler P, Burriesci G (2010) Mitral valve dynamics in structural and fluid-structure interaction models. Med Eng Phys 32:1057-1064 Lee C, Rabbah J-P, Yoganathan A, Gorman R, Gorman J, Sacks M (2015) On the effects of leaflet microstructure and constitutive model on the closing behavior of the mitral valve. Biomech Model Mechanobiol. doi:10.1007/s10237-015-0674-0 Liu P, Liu M (2003) Smoothed particle hydrodynamics: a meshfree particle method. world scientific publishing company, Singapore Maisano F, Redaelli A, Soncini M, Votta E, Arcobasso L, Alfieri O (2005) An annular prosthesis for the treatment of functional mitral regurgitation: finite element model analysis of a dog bone-shaped ring prosthesis. Ann Thorac Surg 79:1268-1275 Mansi T, Voigt I, Georgescu B, Zheng X, Mengue E, Hackl M, Ionasec R, Noack T, Seeburger J, Comaniciu D (2012) An integrated frame- work for finite-element modeling of mitral valve biomechanics from medical images: application to mitralclip intervention planning. Med Image Anal 16:1330-1346 Mansi T, Voigt I, Mengue E, Ionasec R, Georgescu B, Noack T, See- burger J, Comaniciu D (2011) Medical image computing and computer-assisted intervention, chapter towards patient-specific finite-element simulation of MitralClip procedure. Springer, Berlin McGee E, Gillinov A, Blackstone E (2004) Recurrent mitral regurgita- tion after annuloplasty for functional ischemic mitral regurgitation. Thorac Cardiovasc Surg 128:916-924 Pierce E, Bloodworth IV C, Naran A, Easley T, Jensen M, Yoganathan A (2015) Novel method to track soft tissue deformation by micro-computed tomography: application to the mitral valve. Ann Biomed Eng. doi:10.1007/s10439-015-1499-9 Prot V, Haaverstad R, Skallerud B (2009) Finite element analysis of the mitral apparatus: annulus shape effect and chordal force distribution. Biomech Model Mechanobiol 8(1):43-55 Rabbah J-P, Saikrishnan N, Yoganathan A (2013) A novel left heart simulator for the multi-modality characterization of native mitral valve geometry and fluid mechanics. Ann Biomed Eng 41(2):305-315 Reimink M, Kunzelman K, Cochran R (1996) The effect of chordal replacement suture length on function and stresses in repaired mitral valves: a finite element study. J Heart Valve Dis 5:365-375 Reimink M, Kunzelman K, Verier E, Cochran R (1995) The effect of anterior chordal replacement on mitral valve function and stresses. ASAIO Trans 41:M754-M762 Rim Y, Laing S, McPherson D, Kim H (2013) Mitral valve repair using ePTFE sutures for ruptured mitral chordae tendineae: a computational simulation study. Ann Biomed Eng. doi:10.1007/s10439-013-0908-1 Sacks M (2003) Incorporation of experimentally-derived fiber orien- tation into a structural constitutive model for planar collagenous tissues. J Biomech Eng 125(2):280-287 Sacks M, Enomoto Y, Graybill J, Merryman W, Zeeshan A, Yoganathan A, Levy R, Gorman R, Gorman J (2006) In-vivo dynamic defor- mation of the mitral valve anterior leaflet. Ann Thorac Surg 82(4):1369-1377 Schievano S, Kunzelman K, Nicosia M, Cochran R, Einstein D, Khambadkone S, Bonhoeffer P (2009) Percutaneous mitral valve dilatation: single balloon versus double balloon. A finite element study. J Heart Valve Dis 18:28-34 Stevanella M, Maffessanti F, Conti C, Votta E, Arnoldi A, Lombardi M, Parodi O, Caiani E, Redaelli A (2011) Mitral valve patient- specific finite element modeling from cardiac MRI: application to an annuloplasty procedure. Cardiovasc Eng Technol 2(2):66-76 Toma M, Jensen M, Einstein D, Yoganathan A, Cochran R, Kunzelman K (2015) Fluid-structure interaction analysis of papillary muscle forces using a comprehensive mitral valve model with 3D chordal structure. Ann Biomed Eng. doi:10.1007/s10439-015-1385-5 Vesely I, Boughner D (1989) Analysis of the bending behaviour of porcine xenograft leaflets and of natural aortic valve material: bending stiffness, neutral axis and shear measurements. J Biomech 22:655-671 Votta E, Le T, Stevanella M, Fusini L, Caiani E, Redaelli A, Sotiropoulos F (2013) Toward patient-specific simulations of cardiac valves: state-of-the-art and future directions. J Biomech 46(2):217-228 Wenk J, Zhang Z, Cheng G, Malhotra D, Acevedo-Bolton G, Burger M, Suzuki T, Saloner D, Wallace A, Guccione J, Ratclifee M (2010) First finite element model of the left ventricle with mitral valve: insights into ischemic mitral regurgitation. Ann Thorac Surg 89:1546-1554 |
||||||||||||||||||||||||||||||||||||||||||||


Contact Us
Phone
+1-516-686-3765
Address
Dept. of Osteopathic Manipulative Medicine
College of Osteopathic Medicine
New York Institute of Technology
Serota Academic Center, room 138
Northern Boulevard, P.O. Box 8000
Old Westbury, NY 11568
mtoma@nyit.edu