

Message
Message
|
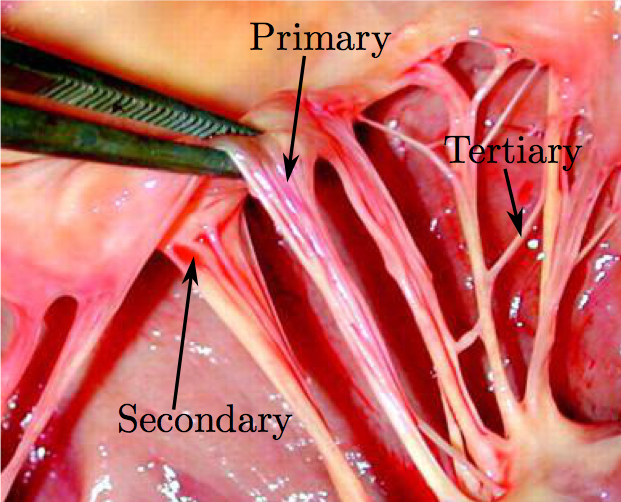
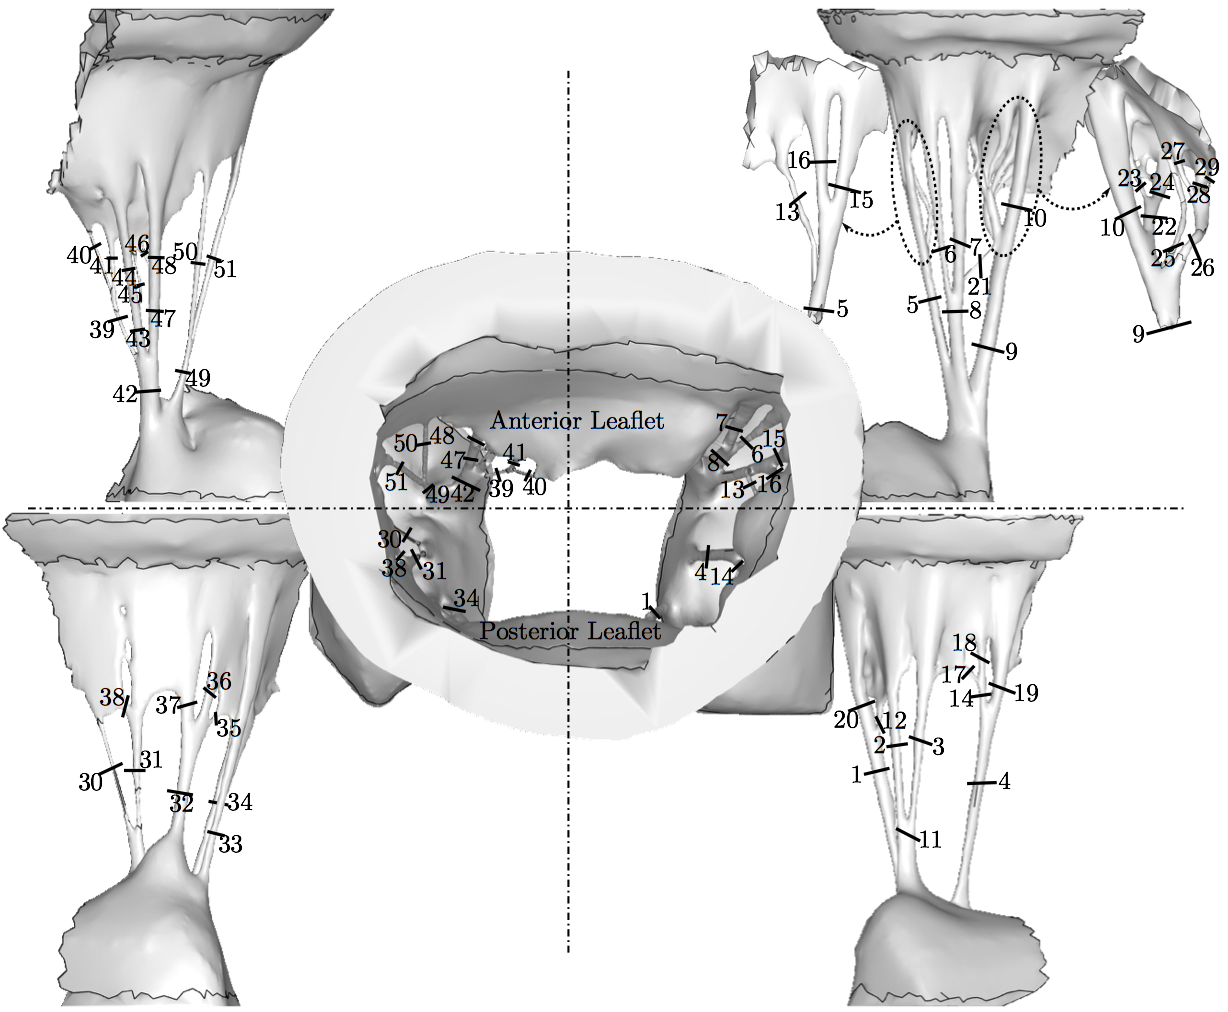
doi: 10.1007/s10439-016-1727-y Fluid-Structure Interaction Analysis of Ruptured Mitral Chordae TendineaeAbstractThe chordal structure is a part of mitral valve geometry that has been commonly neglected or simplified in computational modeling due to its complexity. However, these simplifications cannot be used when investigating the roles of individual chordae tendineae in mitral valve closure. For the first time, advancements in imaging, computational techniques, and hardware technology make it possible to create models of the mitral valve without simplifications to its complex geometry, and to quickly run validated computer simulations that more realistically capture its function. Such simulations can then be used for a detailed analysis of chordae-related diseases. In this work, a comprehensive model of a subject-specific mitral valve with detailed chordal structure is used to analyze the distinct role played by individual chordae in closure of the mitral valve leaflets. Mitral closure was simulated for 51 possible chordal rupture points. Resultant regurgitant orifice area and strain change in the chordae at the papillary muscle tips were then calculated to examine the role of each ruptured chorda in the mitral valve closure. For certain subclassifications of chordae, regurgitant orifice area was found to trend positively with ruptured chordal diameter, and strain changes correlated negatively with regurgitant orifice area. Further advancements in clinical imaging modalities, coupled with the next generation of computational techniques will enable more physiologically realistic simulations.1. IntroductionThe mitral valve (MV) is responsible for maintaining forward blood flow from the left atrium (LA) to the left ventricle (LV). It is composed of two leaflets: the anterior, which is comprised of one contiguous scallop, and the posterior, which is comprised of the smaller P1, P2, and P3 scallops. Numerous chordae tendineae, which attach the leaflets to the LV wall via the papillary muscles, connect to each leaflet both along its free edge (primary chordae) and across its ventricular face (secondary chordae) (Fig. 1). Some smaller chordae (tertiary) do not connect to the leaflet, but rather provide connections between adjacent chordae.
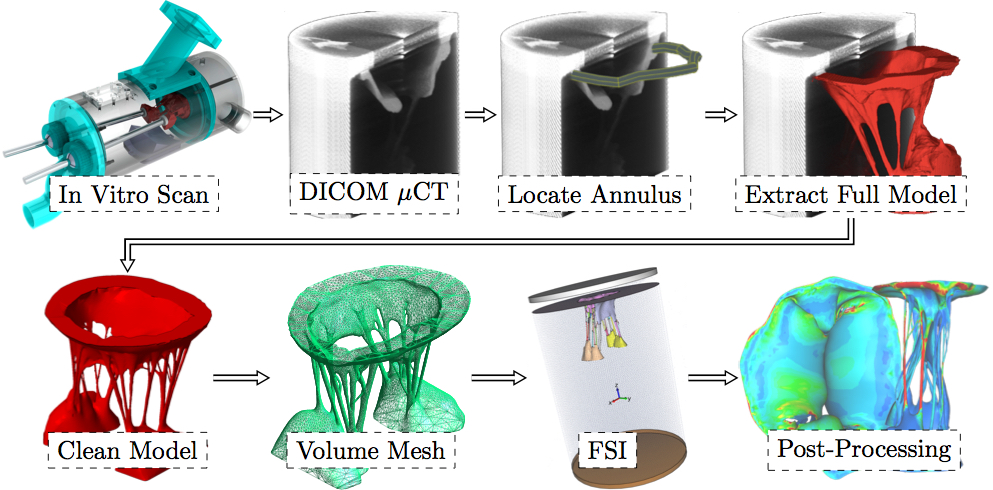
Competent MV closure during cardiac contraction depends on a well orchestrated force balance across these structures. Loss of function of one or more chordae disrupts the link between the MV and the LV. Chordal rupture is frequently observed clinically; it may be idiopathic, or a consequence of connective tissue disorders, trauma [11], infective endocarditis [28], rheumatic heart disease [2], or spontaneous rupture [14,9]. Chordal rupture can lead to leaflet prolapse [10], which is a primary mechanism of mitral regurgitation (MR), the most common form of significant heart valve disease [27]. The specific leaflet segment that prolapses, and the severity of the resultant MR, vary according to the particular ruptured chorda. Individual chordae may be classified according to size, branch type, or position, however, the connection between chordal class and the valve's response to its rupture has yet to be studied. Systematic investigation into the loss of leaflet coaptation that results from specific classes of chordal rupture could provide insight into possible treatments and/or treatment planning.To begin to understand the mechanics governing MV function, finite element analysis was introduced decades ago for normal [15], diseased [16,18,19] and surgically repaired states [4,32,20,31]. More recently, we and others have utilized fluid-structure interaction (FSI) analysis to understand the complex dynamics of mitral valvular function [7,6,17,5,38,3]. Most of these models utilized MV geometries obtained either by parametric modeling, by image reconstruction of markers placed on the valvular apparatus, or from excised valve specimens. More recently, MV modeling strategies have been transitioning to morphologically realistic patient-specific MV modeling utilizing real-time 3D imaging data [29,41,42]. However, one of the obstacles limiting patient-specific modeling has been the inability to accurately represent the complex chordal structure of the native valve. Moreover, certain experimental research studies, such as our previous study of forces exerted on the chordae from papillary muscles [12], cannot be used for validation of computational simulations that use simplified chordal structure. While in the experimental settings, such as in vivo, it has already been attempted to classify the importance of certain chordal groups [13]. Therefore, in addition to providing increased applicability, it is likely more accurate if the full and detailed subject-specific chordal structure is preserved in the model used. To increase computational efficiency, most current models of the MV also use simplified element types to represent chordae tendineae and leaflet geometry. Models commonly take advantage of the chordal cable-type structure to justify the use of rod elements and the thinness of the leaflets to justify the use of shell elements [5,33,24,34,43,23,35,21]. Some models do represent the leaflets with 3D elements (e.g. tetrahedral) but often only utilizing a single layer in order to reduce computational time. Furthermore, the detailed 3-D branching nature of the chordae has not been well represented. These simplifications may limit the accuracy of the computational results. Improved anatomic accuracy is necessary for a thorough investigation of valvular dynamics post-chordal rupture. We have recently developed and validated an ex vivo MV imaging methodology and associated computational platform, wherein the subject-specific MV geometry can be modeled with an unprecedented level of leaflet and chordal detail [40]. For the first time, secondary and tertiary chordae are incorporated into FSI simulations of MV closure using a detailed finite element model. Using this new simulation capability with an explanted ovine MV, the goal of this study was to understand the sensitivity of this specific geometry to the rupture of any of the 51 possible chordae tendineae rupture points. Following rupture of each chorda in at least one location, valve closure was simulated. The resulting regurgitant orifice area (ROA) was analyzed, along with the change in strain in the subvalvular apparatus. 2. MethodsModel DevelopmentFigure 2 shows the pipeline of the entire computational process from imaging the explanted MV through creating the surface mesh, volume mesh, running FSI analysis to post-processing the results.
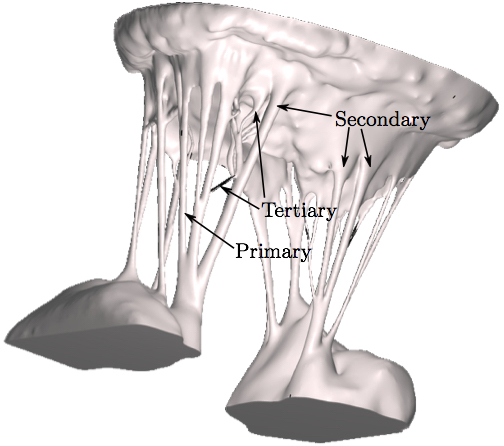
As shown in Fig. 2, there are five phases that need to be completed in order to reach the computational results of the subject-specific MV with preserved chordal structure. Firstly, the MV must be imaged in order to obtain the raw volume. Secondly, processing must be performed on the volume to create a 3D model. Next, a high quality robust mesh must be generated using this 3D model. Then, the numerical algorithms must be employed to produce solutions, e.g. the closure of the leaflets. And, lastly, the results must be post-processed and analyzed. Here, acquiring high resolution images of MV geometry is necessary for accurate modeling. However, no existing clinical imaging modality is capable of visualizing the full MV anatomy with adequate spatial or temporal resolution. For this purpose, our extensively validated Georgia Tech Left Heart Simulator (CLHS) is an ideal tool to reproduce realistic geometries of explanted MVs, which can be imaged by microcomputed tomography (µCT) [30]. Locally sourced ovine MV was first excised, then mounted onto the annulus plate of the pulsatile CLHS. Ultrasound imaging (Philips iE33 xMATRIX, Philips Healthcare, Andover, MA) was used to view valve closure parameters under pulsatile flow. Papillary muscle positions were then adjusted to achieve healthy closure. The chamber was then dismounted from the pulse-duplicator in preparation for µCT imaging. All imaging was done by an Inveon µCT Scanner (Siemens Medical Solutions USA, Inc., Malvern, PA) optimized to image soft tissue (80 kV energy, 500 µA intensity, 650 ms integration time) at 43.29 µm isotropic voxel resolution. A novel technique for treating MV specimens in preparation for µCT scanning was used to obtain an MV image significantly more detailed in chordal structure, accurate in leaflet shape, and close to its physiological diastolic geometry than ever before achieved [40]. The resulting geometry is shown in Fig. 3.
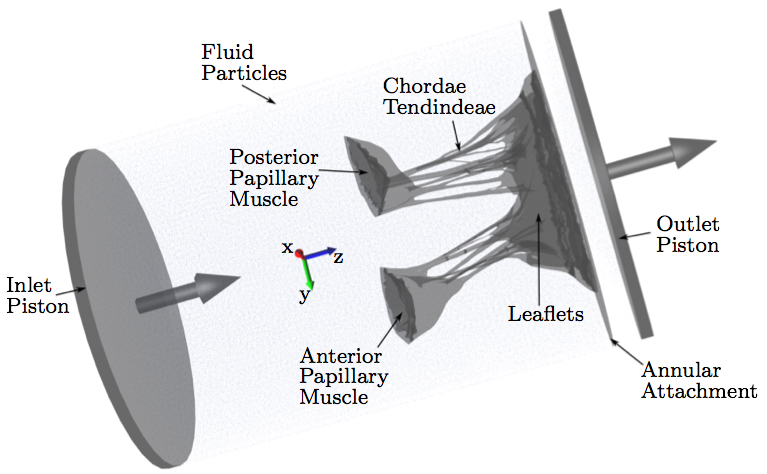
Computational ModelAfter µCT image processing and mesh generation, an FSI approach was used to simulate the opening and closing of the valve. Image acquisition and processing, mesh generation and segmentation, fiber directions calculation and constitutive modeling with the material parameters used are explained in detail in our previous work [38,40,37].Various approaches have been adopted to address the challenge of modeling valve function using FSI. In this study, we adopted an approach based on smoothed particle hydrodynamics (SPH), wherein the fluid is modeled as a collection of discrete particles [22]. Fluid motion and boundary interaction was solved with the IMPETUS Afea SPH Solver (IMPETUS Afea AS, Norway), while large deformation in the solid MV was simultaneously solved with the IMPETUS Afea Solver. Both the solvers use a GPU workstation for parallel processing, thus avoiding the need for a large computer cluster. Parallelization of fully coupled FSI systems for computer clusters is still a challenging and developing field [39]. All solid elements were fully integrated, removing the possibility of hourglass modes and element inversion that plague the classic under-integrated elements. Both fluid and solid domains, and their interaction, were solved with an explicit integration scheme. All simulations were solved on a standard workstation. Parallel acceleration was achieved with a Tesla K40 GPU with 12 GB of Graphic DDR memory and 2880 CUDA Cores. To confirm that convergence was reached, h-refinement of the finite element mesh was performed and the solution was found to yield the same results. The fluid particles were confined in a pipe-like rigid structure surrounding the model, and two pistons moved within the pipe at a prescribed velocity (Fig. 4). The nodes at the bottom of the papillary muscles were fixed in all three directions, as well as the nodes on the annular attachment. The MV model consisted of 92,640 tetrahedral elements, and 476,199 fluid particles were used to represent the fluid. The resulting simulated closure of the MV model has been previously validated and showed a strong agreement to the µCT scan of the closed valve [40]. The resulting simulated forces on the chordae tendineae throughout the cardiac cycle were also validated against experimental data [38].
We have also demonstrated that fully resolved 3D models of the mitral valve require an FSI analysis to correctly load the valve [37]. This fully validated MV model can now be used to analyze various chordae-related pathologies and repair techniques. The constitutive model for the material properties utilized a three-dimensional splay invariant, based on an approximation of a three-dimensional Gaussian distribution of fibers [8]. The model is defined in terms of the 2nd Piola-Kirchhoff stress, S, as follows
where J is Jacobian, κ is bulk modulus, σi is passive fiber stress-strain rule for the ith (1 or 2) fiber population, ε is active fiber stress-strain rule, Dev is deviatoric projection operator, and C is right-Cauchy deformation, and λi is dispersed fourth invariant defined as
where C is the isochoric part of the right-Cauchy deformation, K is called the dispersion tensor or anisotropy tensor and is given in global coordinates; note, as K embodies the concept of dispersion, λ is not a stretch in a classical sense. The matrix K is governed by splay parameters described in literature [8]. The material parameters and more detailed description of the material model is presented in the previous papers utilizing this model [38,40,37]. Simulating and Assessing Chordal RuptureThe importance of individual chordae tendinae was assessed by simulating ruptures in every possible branch of the chordal tree. This amounted to 51 rupture points (Fig. 5). The ruptures were produced by removing the elements from the volume mesh at half-length of the chorda which usually is the location of its minimum waist. For each ruptured model, the resulting systolic geometry after the closure was compared to the original model (referred to as the 'healthy' model) with all chordae preserved. Additionally, strain in the subvalvular apparatus of the MV was evaluated after closure simulations following each chordal rupture.
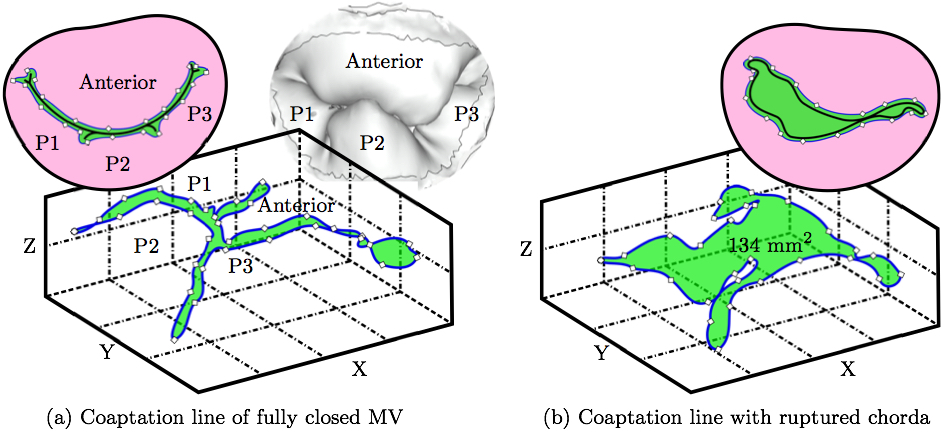
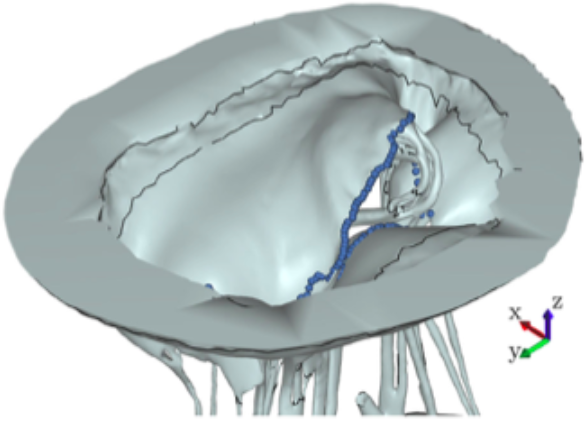
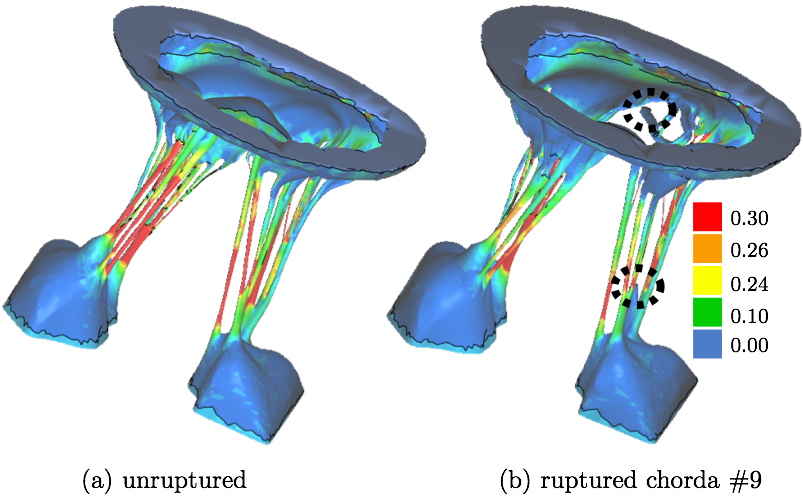
The impact of chordal rupture on MV closure geometry was assessed as follows. First, the nodes enclosing the coaptation line at full closure were identified in the no rupture, i.e. healthy, control case, Fig. 6a. Along the coaptation line, coordinates of node ni are xi, yi and zi. The area, A, of a polygon in the space formed by the nodes of the coaptation line with coordinates vectors x, y and z is calculated using a function from a library geom3D called polygonArea3d [1]. Even though zero area would be expected in the case of a healthy and perfectly simulated closure (Fig. 6a), small imperfection in the simulation, and especially manual identification of the nodes enclosing the coaptation line lead to a small non-zero value, i.e. 2.13 mm2. This area is hereafter referred to as the Coaptation Line Enclosed Area (CLEA). Then, the same nodes were used to compute the enclosed area in the FSI results of each ruptured chorda case, e.g. Fig. 6b, and all the CLEA values are reported after being offset by 2.13 mm2 to compensate for the above mentioned imperfection. Note, in this way, the CLEA represents an approximation of the true ROA. We selected this approach because the alternative approach of directly identifying the ROA would risk significant error, due to the required manual node selection following each rupture simulation.
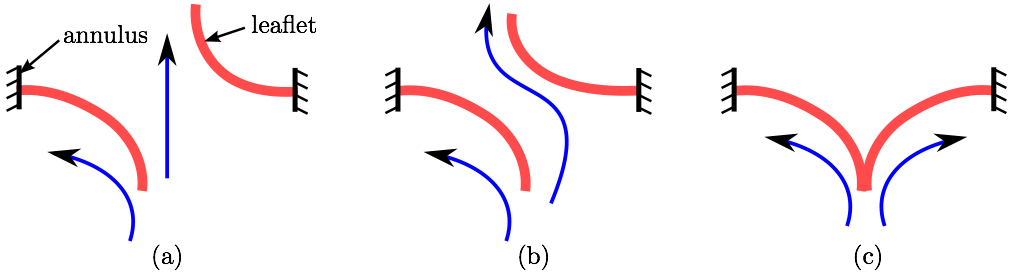
As explained in a review article by Thavendiranathan et al. [36], the best way to measure the ROA is using 3D techniques. The Fig. 7 demonstrates the different scenarios that can occur with rupture of a different chorda. Using the most common 2D techniques the ROA would not be accurately captured when the leaflets are on top of each other yet separated allowing the back-flow to happen (Fig. 7b). This kind of ROA is referred to, by Thavendiranathan et al., as anatomic ROA. Furthermore, considering that in this model the coaptation zone between the leaflets was small, the nodes manually selected near the coaptation line would always capture the outline of the ROA. Despite our confidence that this node selection leads to accurate ROA, in this work we decided to call it CLEA to avoid misconceptions.
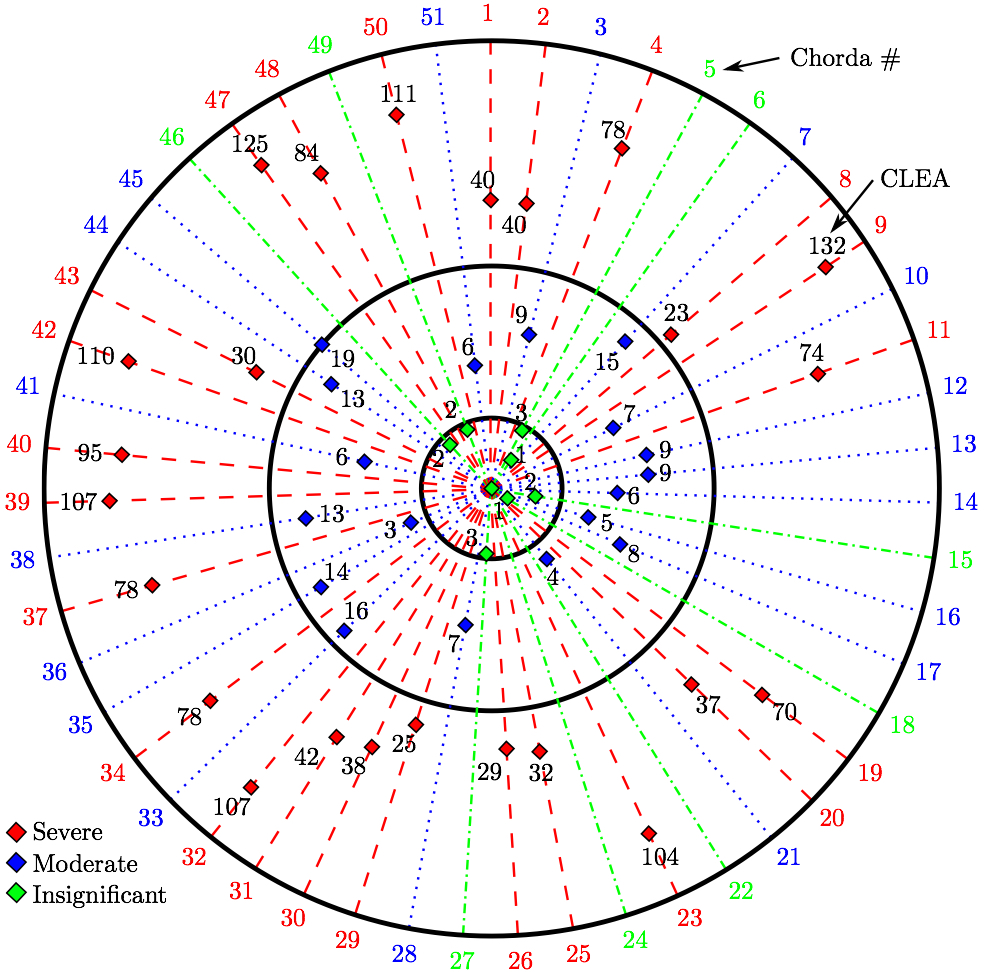
3. RESULTSTwo variables were used to assess the rupture: our approximation of the ROA explained above, and strain values measured in papillary muscle tips. These variables were computed for all 51 simulations and we analyzed the correlation between the diameters of the ruptured chordae and these variables as follows.Coaptation Line Enclosed AreaAfter simulated chordal rupture, CLEA was measured for all 51 cases and summarized in Fig. 9. For example, CLEA of # 9 is 134 mm2 (Figs. 6b and 8), which is approximately 132 mm2 after being offset by 2.13 mm2. Each number in Fig. 9 within the three circles (thresholds) represents one chorda and indicates the resulting CLEA. Among all chordae, mean ± SD CLEA was 38 ± 40 mm2. With CLEA ranging from 1 to 132 mm2, it is evident that the impact of chordal rupture on CLEA varies greatly with the specific ruptured chorda.
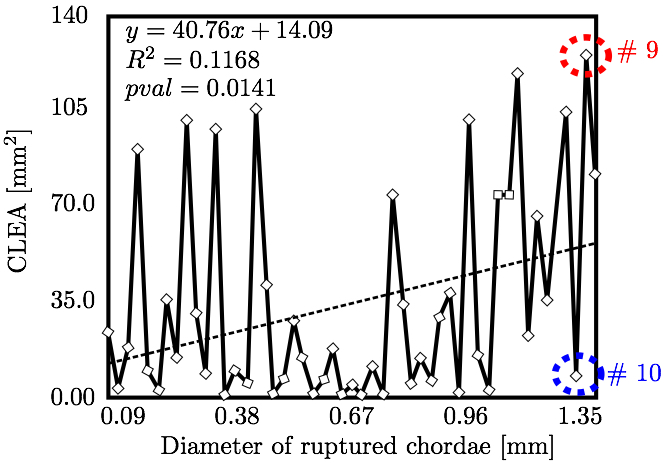
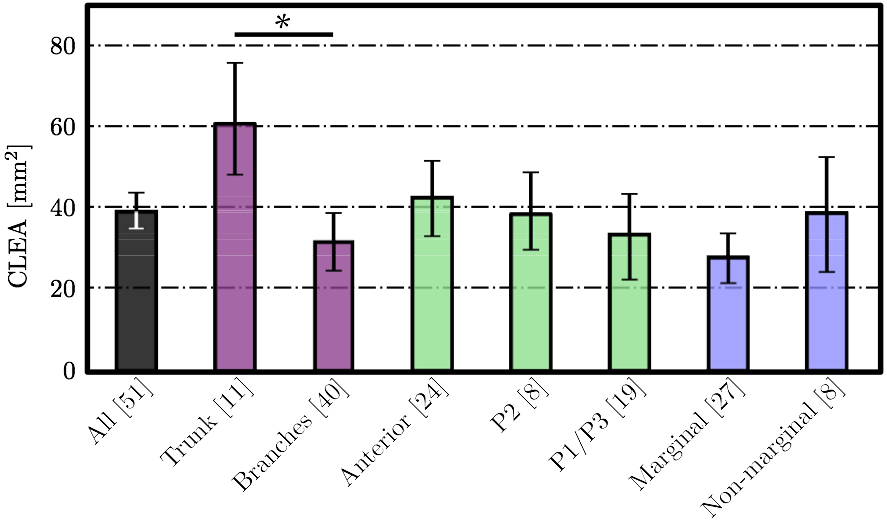
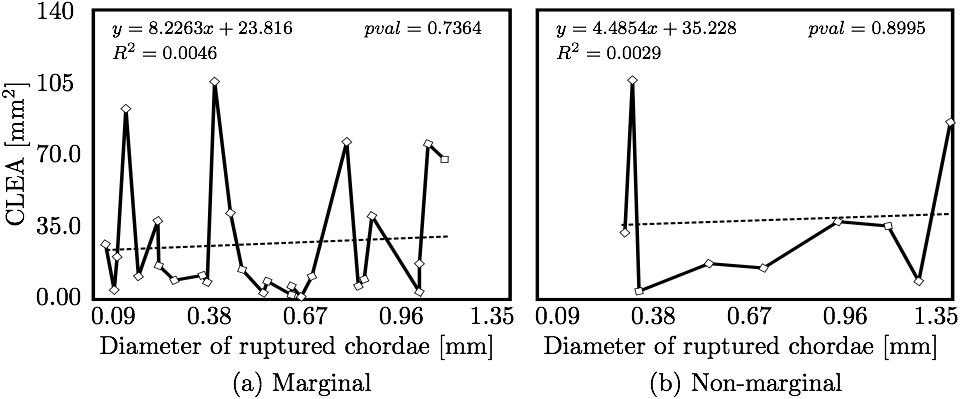
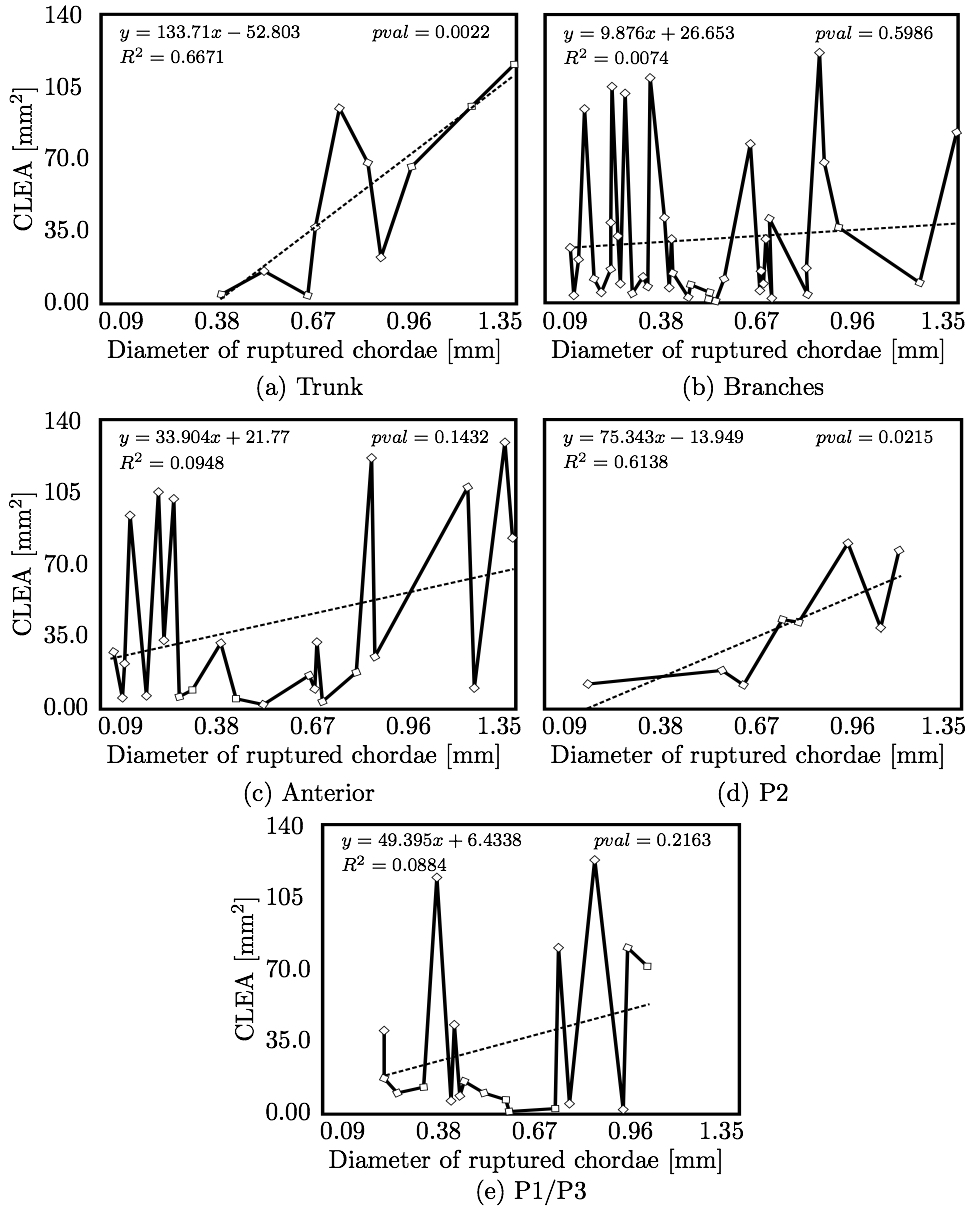
We hypothesized that CLEA would trend positively with diameter of the ruptured chorda (Fig. 10). Indeed, a statistically significant positive trend was observed (p < 0.05); however, the correlation of CLEA to chordal diameter was very weak (R2 = 0.1168). CLEA was observed to differ meaningfully following subclassification of chordae based on chordal segment (trunk or branch), leaflet of insertion (anterior, P2, or P1/P3), or region of insertion (marginal or non-marginal) (Fig. 11). Of note, trunk chordal rupture induced significantly greater CLEA than branch rupture (p < 0.05). This suggested that stronger correlations between CLEA and chordal diameter may exist within these subclasses. Results of these investigations are presented in Figs. 12 and 13. It was observed that diameter of the ruptured chorda was a strong predictor of the resulting CLEA, specifically among trunk chordae or chordae inserting into the P2 leaflet. Other subclasses did not reveal significant correlations.
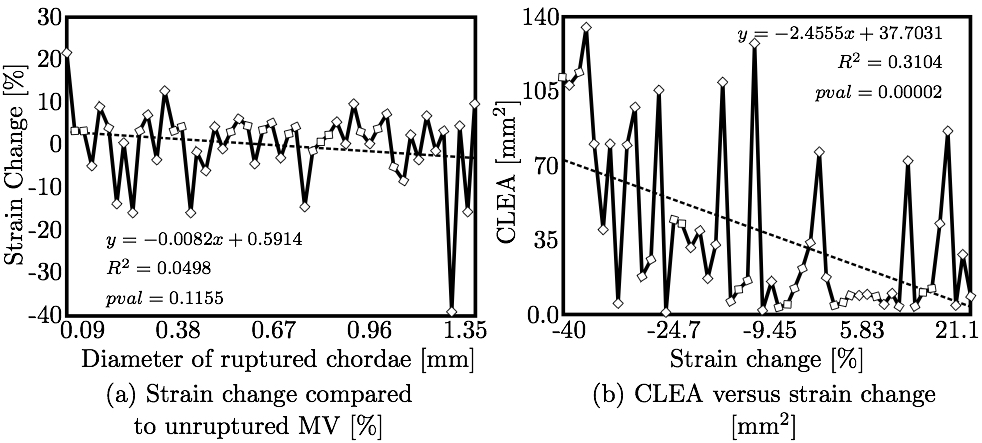
Strain Values at Papillary Muscle TipsFinally, the change in strain in the subvalvular apparatus was evaluated after chordal rupture and closure simulations (e.g. Fig. 14). It can be observed that the mean levels of strain in all chordae are lower when a chorda is ruptured, because the pressure in the left ventricle is also to be lower due to reversed blood flow through the resulting non-zero CLEA. Figure 15a shows the change in mean strain vs. the diameter of the ruptured chorda; little to no correlation was observed. However, as shown in Fig. 15b, strain change did correlate strongly to CLEA. This result is reasonable, given the similarity between CLEA and the ROA, through which left ventricular pressure is relieved.
4. DISCUSSIONThe novel modeling platform outlined here combines the use of cutting-edge software, GPU technology, and in vitro imaging methodologies. Fluid-structure interaction modeling using high resolution images of explanted mitral valves enables examination of dynamic phenomena of valve closure, whereas previously used models are only able to interrogate the start and end state of valve closure. Additionally, the distinction of subject specific chordal branching and topology enables an unprecedented look into the mechanics and function of the subject-specific chordal tree in computational simulation. The utility of the platform is demonstrated here by simulating chordal discontinuities (cuts/ruptures) systematically in each chordal segment, and examining the resulting mechanical effects on valve closure. The effect on simulated valve closure resulting from these chordal ruptures was examined; CLEA and strain in PM tips in the resulting closed model were compared with those values observed in the healthy model.After simulated chordal rupture, CLEA was measured and summarized in Fig. 9. The data in Fig. 9 can be analyzed together with Fig. 5 to find out what type of chorda causes what level of approximated regurgitation. For example, chorda #10 is of large diameter, but its rupture only results in small to moderate regurgitation. As can be seen, in Fig. 5, that particular chorda is reinforced by multiple surrounding smaller chordae that can take over the increased load [25]. Similar observation can be made based on Fig. 10, where the rupture points in chordae #9 and #10 yield very different CLEA values despite of the chorda being of similar thickness. The CLEA depends not only on the diameter of the ruptured chorda but also on its location and its relationship with surrounding chordae. When examining the relationship of ruptured chorda diameter with CLEA in groups of chordae, significant positive trends were found in the trunk chordae and in those chordae inserting into the P2 segment of the posterior leaflet (Fig. 13). Though general trends were identified, outliers were found within each grouping, illustrating the importance of subject-specific modeling. For example, rupture of some small chordae resulted in significant CLEA after closure. On the other hand, some ruptures did not lead to significant change to closure geometry. In these cases, heightened strain on neighboring chordae was observed, as they took on the load-bearing function lost by the ruptured chord. Such phenotypes, though not acutely problematic, could promote chronic disease states via subsequent chordal ruptures, valvular/ventricular remodeling, or some combination thereof. In other cases, the rupture prompted significant increases in CLEA. This type of response is more representative of acute disease, where the patient experiences sudden regurgitation, pulmonary hypertension, and edema leading to acute morbidity. In quantifying strain in the subvalvular apparatus, it was observed that with a larger CLEA, pressure buildup inside the left ventricle was reduced, and the peak loads exerted on the chordae tendinae were smaller. Though chordal rupture is often a pathological event, chordal cutting during valve repair is sometimes used to relieve leaflet tethering and enhance valve closure [26]. However, we have shown here that the removal of chordae without change to the CLEA will increase the strain in the subvalvular apparatus by distributing the same load over fewer chordal supports. This may lead to additional unintended chordal rupture following the therapeutic procedure. Of course, certain limitations exist in the methodology used in the study. First, the imaging and modeling components of the platform are labor intensive, and only currently suitable for long term investigation within the research environment. Translation of the platform to clinical usage is distant. Also, though significant improvements have been made in sample preparation for µCT imaging, some details in the chordal structure remain indiscernible, namely in the commissures of the MV. Another limitation is the use of idealized, cylindrical geometry representing the left ventricle. Future work will seek to reproduce the left ventricular geometry within the simulation platform, first with rigid and then with moving walls. By simulating the MV function within a left ventricle geometry, we can understand the impact of MV disease and repair on ventricular filling and function. Also, we have not used the experimental set-up to directly validate the regurgitation related to the rupture of some of the chordae. Even though the validation would not be difficult, chordal rupture is non-reversible, so it is impossible to validate for any more than one rupture. We have made the assumption that a simulation that yields a validated closure of a healthy MV will also accurately model simulated pathologies. And, more subject-specific valves are to be simulated to draw statistically stronger conclusions. However, even with these limitations in mind, one can draw two main points from this work; (1) even small chordae with small diameter can cause large ROA, and (2) only certain subclassifications have a strong correlation of ROA to chordal diameter. As chordal rupture is both pathological and palliative, the results illustrate the importance of understanding the positive and negative effects on valve closure. In the pathological case, this work gives insight into acute valve behavior following chordal rupture, and may lead to a better understanding of mechanisms underlying chronic remodeling following these events. In the palliative case, future work will look into the chordal cutting procedure as a method of alleviating leaflet tethering after ischemic left ventricular remodeling and mitral regurgitation. A mechanistic understanding of the load redistribution and mitral regurgitation following this procedure could assist surgeons in planning the procedure and deciding the appropriate chordal cutting strategy for optimal surgical results. This platform is useful not only for chordal rupture modeling; in fact, with new methods for interventional simulation under development, many different types of valve repair operations can be simulated. Results have the potential to inform mechanistic outcomes of these different procedures at an unprecedented level of detail. ACKNOWLEDGMENTSThis study was supported by a grant from the National Heart Lung and Blood Institute (R01-HL092926) and by a grant from the National Science Foundation Graduate Research Fellowship (DGE-1148903).CONFLICT OF INTERESTNo benefits in any form have been or will be received from a commercial party related directly or indirectly to the subject of this manuscript.REFERENCES1 Amberg, B., S. Romdhani, and T. Vetter. Optimal step nonrigid icp algorithms for surface registration. In: IEEE Conference on Computer Vision and Pattern Recognition, 2007. CVPR'07. IEEE, Piscataway, 2007, pp. 1-8.2 Anderson, Y., N. Wilson, R. Nicholson, and K. Finucane. Fulminant mitral regurgitation due to ruptured chordae tendinae in acute rheumatic fever. J. Paediatr. Child Health 44(3): 134-137, 2008. 3 Chandran, K.B., and H. Kim, Computational mitral valve evaluation and potential clinical applications. Ann. Biomed. Eng. 43(6): 1348-1362, 2014. 4 Cochran, R.P., and K.S. Kunzelman. Effect of papillary muscle position on mitral valve function: relationship to mitral homografts. Ann. Thorac.Surg. 66(Suppl): S155-161, 1998. 5 Einstein, D.R., F. DelPin, X. Jiao, A.P. Kuprat, J.P. Carson, K.S. Kunzelman, R.P. Cochran, J.M. Guccione, and M.B. Ratclifee. Fluid-structure interactions of the mitral valve and left heart: Comprehensive strategies, past, present, and future. Int. J. Numer. Methods Biomed. Eng. 26(3-4): 348-380, 2010. 6 Einstein, D.R., K.S. Kunzelman, P.G. Reinhall, M.A. Nicosia, and R.P. Cochran. The relationship of normal and abnormal microstructural proliferation to the mitral valve closure sound. Trans. ASME 127: 134-147, 2005. 7 Einstein, D.R., P.G. Reinhall, K.S. Kunzelman, and R.P. Cochran. Nonlinear finite element analysis of the mitral valve. J. Heart Valve Dis. 3: 376-385, 2005. 8 Freed, A.D., D.R. Einstein, and I. Vesely. Invariant formulation for dispersed transverse isotropy in aortic heart valves: an efficient means for modeling fiber splay. Biomech. Model. Mechanobiol. 4: 100-117, 2005. 9 Gabbay, U., and C. Yosefy. The underlying causes of chordae tendinae rupture: a systematic review. Int. J. Cardiol. 143(2): 113-118, 2010. 10 Grenadier, E., G. Alpan, and A. Palant. The prevelance of ruptured chordae tendinae in the mitral valve prolapse syndrome. Am. Heart J. 105(4): 603-610, 1983. 11 Grinberg, A.R., J.D. Finkielman, D. Pineiro, H. Festa, and C. Cazenave. Rupture of mitral chorda tendinae following blunt chest trauma. Clin. Cardiol. 21: 300-301, 1998. 12 Jensen, M.O., A.A. Fontaine, and A.P. Yoganathan. Improved in vitro quantification of the force exerted by the papillary muscle on the left ventricular wall: Three-dimensional force vector measurement system. Ann. Biomed. Eng. 29: 406-412, 2001. 13 Jimenez, J.H., D.D. Soerensen, Z. He, J. Ritchie, and A.P. Yoganathan. Mitral valve function and chordal force distribution using a flexible annulus model: An in vitro study. Ann. Biomed. Eng. 33(5): 557-566, 2005. 14 Kaymaz, C., N. Ozdemir, and M. Ozkan. Differentiating clinical and echocardiographic characteristics of chordal rupture detected in patients with rheumatic mitral valve disease and floppy mitral valve: impact of the infective endocarditis on chordal rupture. Eur. J. Echocardiogr. 6(2): 117, 2005. 15 Kunzelman, K.S., R.P. Cochran, C.J. Chuong, W.S. Ring, E.D. Verier, and R.C. Eberhart. Finite element analysis of the mitral valve. J. Heart Valve Dis. 2: 326-340, 1993. 16 Kunzelman, K.S., R.P. Cochran, C.J. Chuong, W.S. Ring, E.D. Verier, and R.C. Eberhart. Finite element analysis of mitral valve pathology. J. Long Term Eff. Med. Implants 3: 161-179, 1993. 17 Kunzelman, K.S., D.R. Einstein, and R.P. Cochran. Fluid-structure interaction models of the mitral valve: function in normal and pathological states. Phil. Trans. R. Soc. B 362: 181393-1406, 2007. 18 Kunzelman, K.S., M.S. Reimink, and R.P. Cochran. Annular dilatation increases stress in the mitral valve and delays coaptation: A finite element computer model. Cardiovasc. Surg. 5: 427-434, 1997. 19 Kunzelman, K.S., M.S. Reimink, and R.P. Cochran. Flexible versus rigid ring annuloplasty for mitral valve annular dilation: A finite element model. J. Heart Valve Dis. 7: 108-116, 1998. 20 Kunzelman, K.S., M.S. Reimink, E.D. Verier, and R.P. Cochran. Replacement of mitral valve posterior chordae tendineae with expanded polytetrafluoroethylene suture: a finite element study. J. Card. Surg. 11: 136-145, 1996. 22 Lau, K.D., V. Diaz, P. Scambler, and G. Burriesci. Mitral valve dynamics in structural and fluid-structure interaction models. Med. Eng. Phys. 32: 1057-1064, 2010. 22 Liu, P.G.R. and M.B. Liu. Smoothed Particle Hydrodynamics: A Meshfree Particle Method, World Scientific Publishing Company, Singapore, 2003. 23 Maisano, F., A. Redaelli, M. Soncini, E. Votta, L. Arcobasso, and O. Alfieri. An annular prosthesis for the treatment of functional mitral regurgitation: Finite element model analysis of a dog bone-shaped ring prosthesis. Ann. Thorac. Surg. 79(4): 1268-1275, 2005. 24 Mansi, T., I. Voigt, B. Georgescu, X. Zheng, E.A. Mengue, M. Hackl, R. Ionasec, T. Noack, J. Seeburger, and D. Comaniciu. An integrated framework for finite-element modeling of mitral valve biomechanics from medical images: Application to mitralclip intervention planning. Med. Image Anal. 16: 1330-1346, 2012. 25 McCarthy, P.M. A chain is only as strong as its weakest link. J. Thorac. Cardiovasc. Surg. 152(1): e19-e20, 2016. 26 Messas, E., J.L. Guerrero, M.D. Handschumachar, C. Conrad, C.-M Chow, S. Sullivan, A.P. Yoganathan, and R.A. Levine. Chordal cutting: A new therapeutic approach for ischemic mitral regurgitation. Circulation 27104:1958-1963, 2001. 27 Nkomo, V.T., J.M Gardin, T.N Skelton, J.S. Gottdiener, C.G. Scott, and M.E. Sarano. Burden of valvular heart diseases: a population-based study. Lancet 368(9540): 1005-1011, 2006. 28 Portugese, S., H. Amital, A. Tenenbaum, Y. Bar-Dayan, Y. Levy, A. Afek, J. Shemesh, and Y. Shoenfeld. Clinical characteristics of ruptured chordae tendineae in hospital- ized patients: primary tear versus infective endocarditis. Clin. Cardiol. 21(11): 813-816, 1998. 29 Pouch, A.M., P.A. Yushkevich, B.M. Jackson, A.S. Jassaar, M. Vergnat, J.H. Gorman, R.C. Gorman, and C.M. Sehgal. Development of a semi-automated method for mitral valve modeling with medial axis representation using 3D ultrasound. Med. Phys. 39(2): 933-950, 2012. 30 Rabbah, J.-P., N. Saikrishnan, and A.P. Yoganathan. A novel lef heart simulator for the multi-modality characterization of native mitral valve geometry and fluid mechanics. Ann. Biomed. Eng. 41(2): 305-315, 2013. 31 Reimink, M.S., K.S. Kunzelman, and R.P. Cochran. The effect of chordal replacement suture length on function and stresses in repaired mitral valves: A finite element study. J. Heart Valve Dis. 5: 365-375, 1996. 32 Reimink, M.S., K.S. Kunzelman, E.D. Verier, and R.P. Cochran. The effect of anterior chordal replacement on mitral valve function and stresses. ASAIO Trans. 41: M754-M762, 1995. 33 Rim, Y., S.T. Laing, D.D. McPherson, and H. Kim. Mitral valve repair using ePTFE sutures for ruptured mitral chordae tendineae: A computational simulation study. Ann. Biomed. Eng. 42(1): 139-148, 2014. 34 Schievano, S., K.S. Kunzelman, M.A. Nicosia, R.P. Cochran, D.R. Einstein, S. Khambadkone, and P. Bonhoeffer. Percutaneous mitral valve dilatation: Single balloon versus double balloon. a finite element study. J. Heart Valve Dis. 18: 28-34, 2009. 35 Stevanella, M., F. Maffessanti, C.A. Conti, E. Votta, A. Arnoldi, M. Lombardi, O. Parodi, E.G. Caiani, and A. Redaelli. Mitral valve patient-specific finite element modeling from cardiac MRI: Application to an annuloplasty procedure. Cardiovasc. Eng. Technol. 2(2): 66-76, 2011. 36 Thavendiranathan, P., D. Phelan, P. Collier, J. D. Thomas, S. D. Flamm, and T. H. Marwick. Quantitative assessment of mitral regurgitation: How best to do it. JACC Cardiovasc. Imaging CME 5(11): 1161-1175, 2012. 37 Toma, M., D.R. Einstein, C.H. Bloodworth IV, R.P. Cochran, A.P. Yoganathan, and K.S. Kunzelman. Fluid-structure interaction and structural analysis using a comprehensive mitral valve model with 3D chordal structure. Int. J. Numer. Methods in Biomed. Eng. 33(4): e2815, 2017. 38 Toma, M., M.O. Jensen, D.R. Einstein, A.P. Yoganathan, R.P. Cochran, and K.S. Kunzelman. Fluid-structure interaction analysis of papillary muscle forces using a comprehensive mitral valve model with 3D chordal structure. Ann. Biomed. Eng. 44(4): 942-953, 2016. 39 Toma, M., M. Oshima, and S. Takagi. Decomposition and parallelization of strongly coupled fluid-structure interaction linear subsystems based on the Q1/P0 discretization. Comput. Struct. 173: 84-94, 2016. 40 Toma, M., C.H. Bloodworth IV, D.R. Einstein, E.L. Pierce, R.P. Cochran, A.P. Yoganathan, and K.S. Kunzelman. High resolution subject-specific mitral valve imaging and modeling: Experimental & computational models. Biomech. Model. Mechanobiol. 15(6): 1619-1630, 2016. 41 Votta, E., E.G. Caiani, F. Veronesi, M. Soncini, F.M. Motevecchi, and A. Redaelli. Mitral valve finite-element modelling from ultrasound data: a pilot study for a new approach to understand mitral function and clinical scenarios. Philos. Trans. Ser. A 366(1879): 3411-3434, 2008. 42 Votta, E., T.B. Le, M. Stevanella, L. Fusini, E.G. Caiani, A. Redaelli, and F. Sotiropoulos. Toward patient-specific simulations of cardiac valves: state-of-the-art and future directions. J. Biomech. 46(2): 217-228, 2013. 43 Wenk, J.F., Z. Zhang, G. Cheng, D. Malhotra, G.A.-Bolton, M. Burger, T. Suzuki, D.A. Saloner, A.W. Wallace, J.M. Guccione, and M.B. Ratclifee. First finite element model of the left ventricle with mitral valve: Insights into ischemic mitral regurgitation. Ann. Thorac. Surg. 89(5): 1546-1554, 2010. |
||||||||||||||||||||||||||||||||||||||||||||||||||||||||||||||||||

Contact Us
Phone
+1-516-686-3765
Address
Dept. of Osteopathic Manipulative Medicine
College of Osteopathic Medicine
New York Institute of Technology
Serota Academic Center, room 138
Northern Boulevard, P.O. Box 8000
Old Westbury, NY 11568
mtoma@nyit.edu